Project Description
MedStar OCT Lab
Introduction
User Problem
Three User Groups
– Cardiologists
– Cardiologists in training
– Cath Lab Technologists
Business Problem
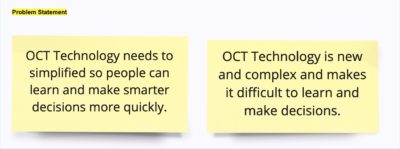
In stent re-stonosis is intimidating and many will pass treating it onto more experienced doctors. OCT imaging can make this process easier but people first need to understand the problem and the technology that can help them. Once they do, they will be more likely to purchase their own OCT imaging solutions enabling Doctors to save more lives.
Solution
Expected Results & Success Metrics
Logistics
Scope
This was an extremely short project with the total hours being slightly over 600. There was not a tight deadline with time, but making sure a complete product was delivered when the hours were used up was critical.
My Role
I was the sole designer on this project. In addition, I handled PM duties initially during the front loaded design phase and dropped off the project once development started.
Main areas of responsibility:
– Creating and running a design workshop with client
– User Research
– Prototyping
– User Testing
– UX Analysis
– Wire frames
– Mock ups
Team Make Up
Team Role |
Hours / Sprint | Total Hours |
|---|---|---|
| Product Manager | NA | 60 |
| UX Designer | NA | 40 |
| Front End Dev | 40 – 80 | 240 |
| Back End Dev | 40 – 80 | 240 |
| QA | NA | 40 |
Solution
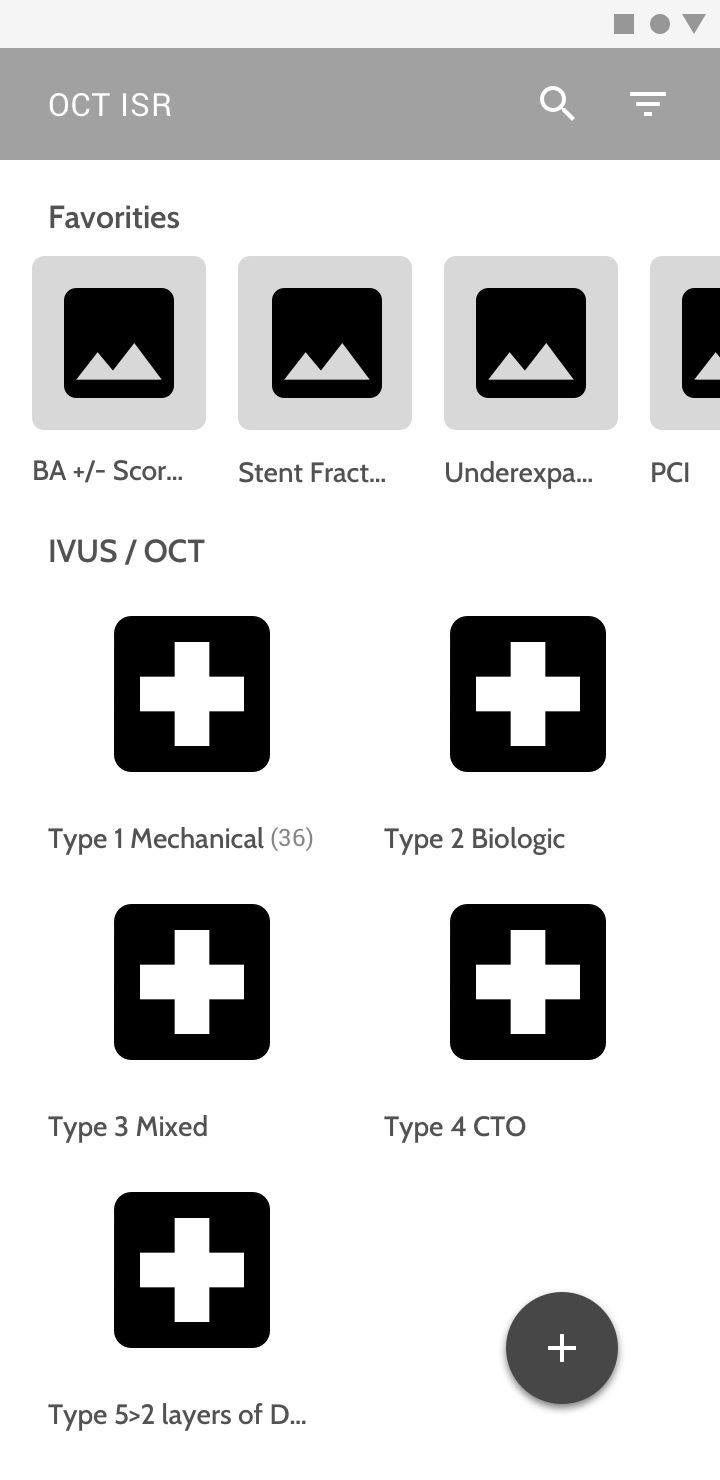
Home Page
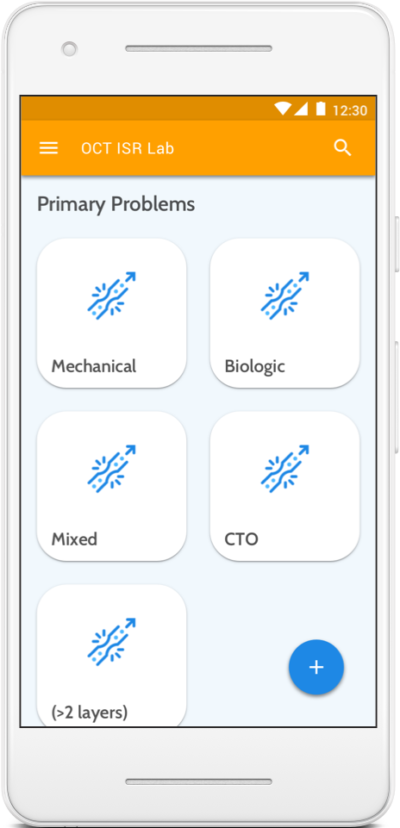
For the Home Page we contracted a Graphic Designer to create some icons. It was extremely important to the client that they had “sexy” icons.
What you can see on the page are the basic medical problem categories that for ISR that OCT is capable of assessing.
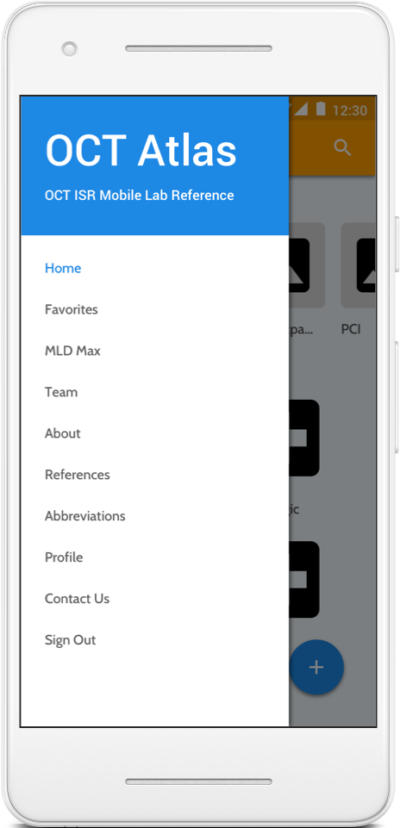
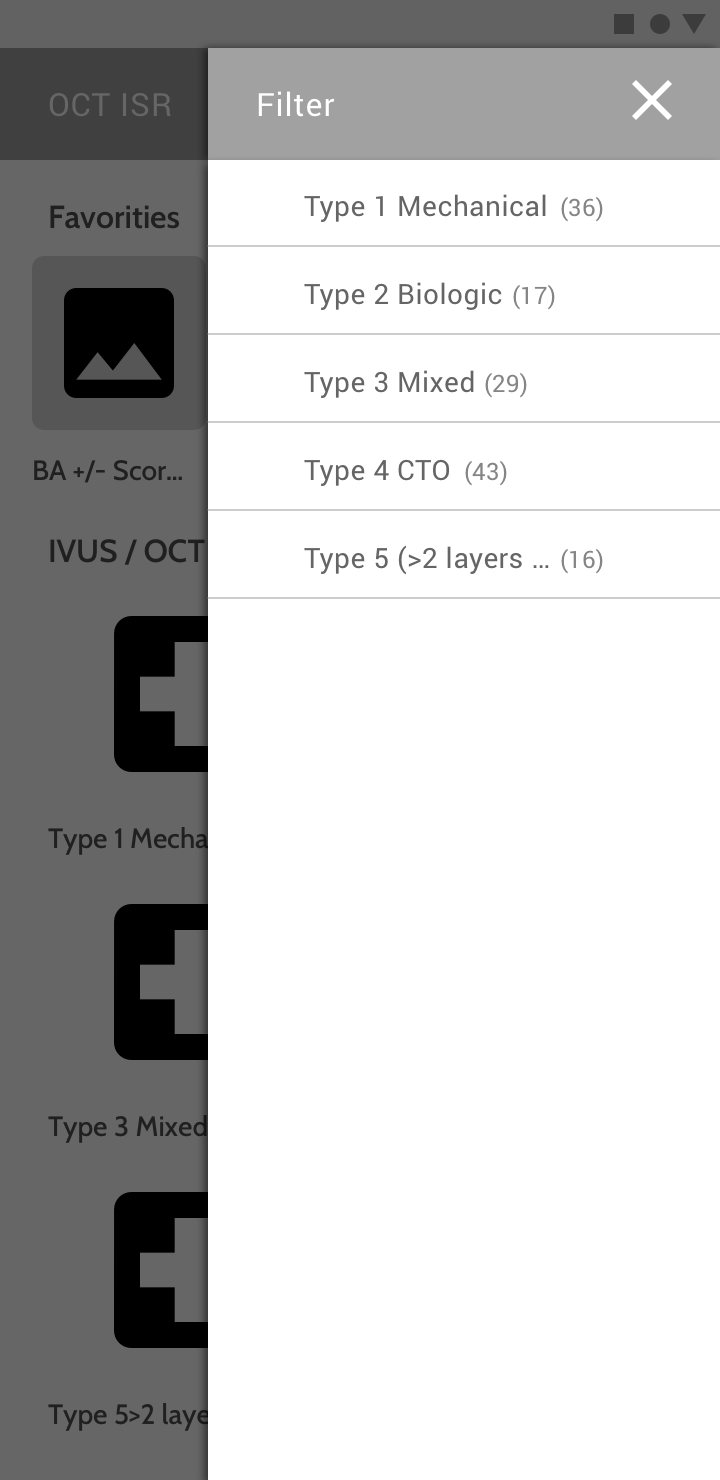
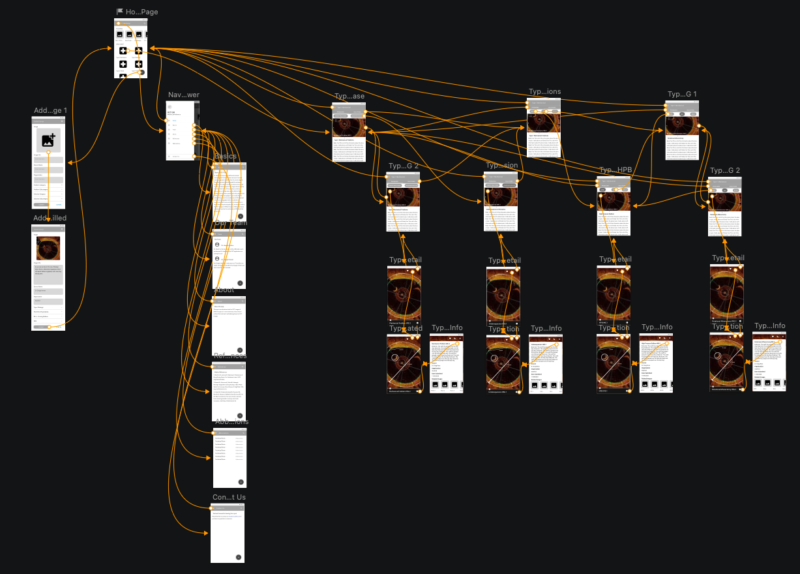
There was no need to attempt anything fancy with the navigation or information architecture. 90% of the application is accessed from the homepage through the five listed categories. Everything else within the drawer is likely to be rarely accessed if ever based on feedback from users.
Problems to Solutions
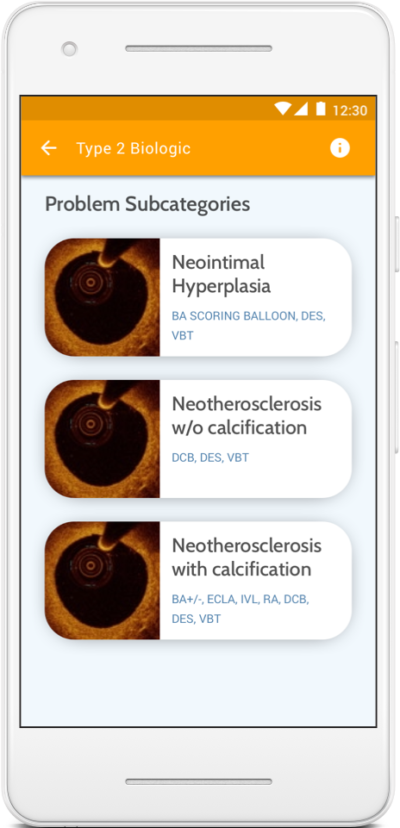
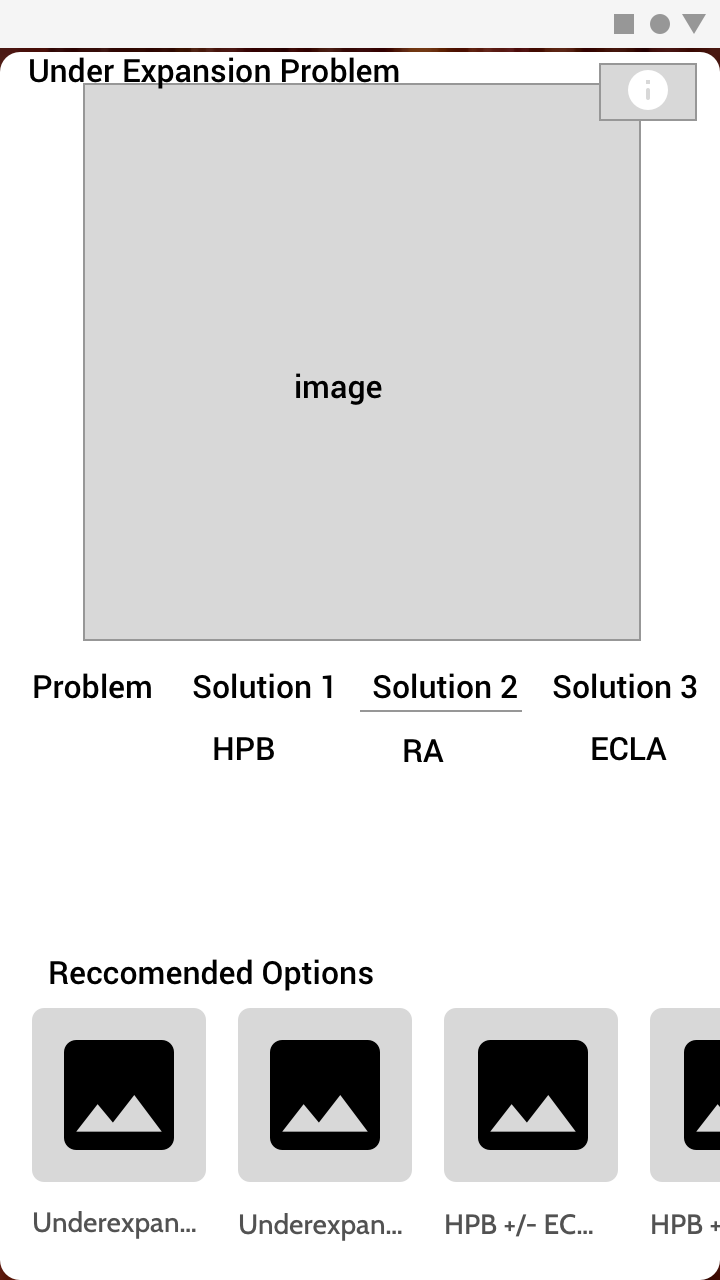
Problem Subcategories Page. Custom icons were being created for these pages as well.
– Some words could not be abbreviated.
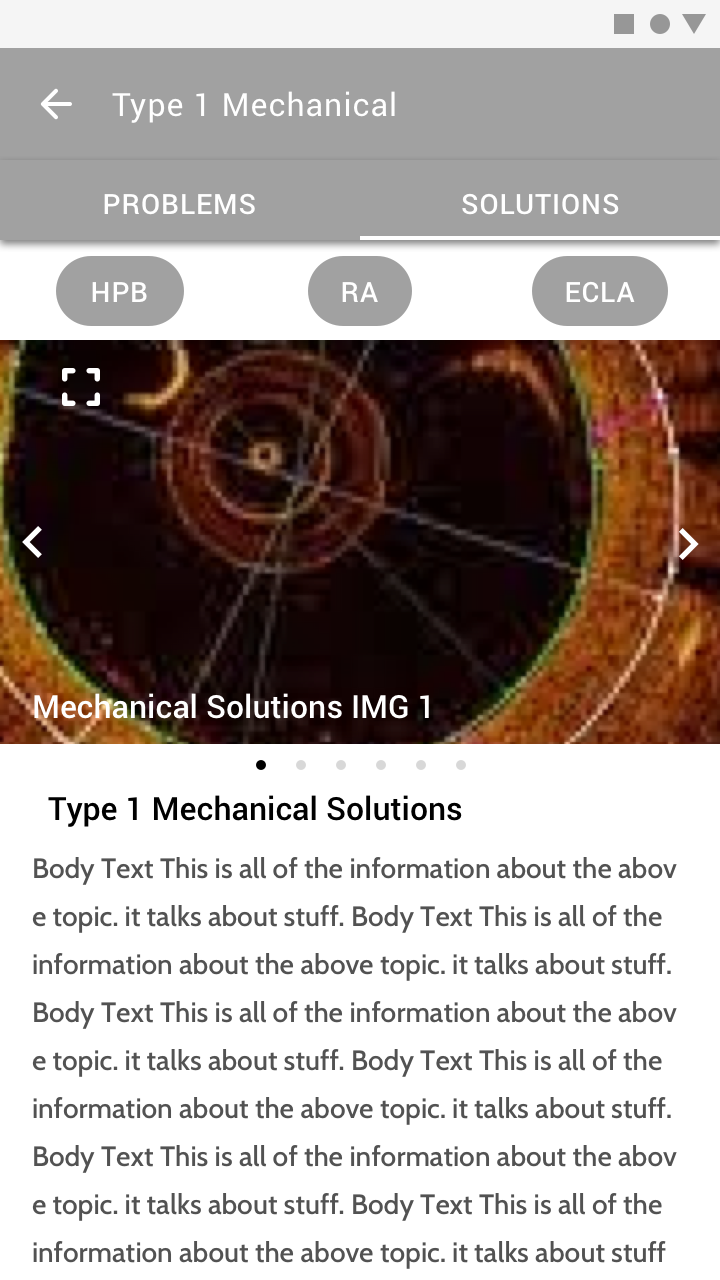
– The treatments are listed below
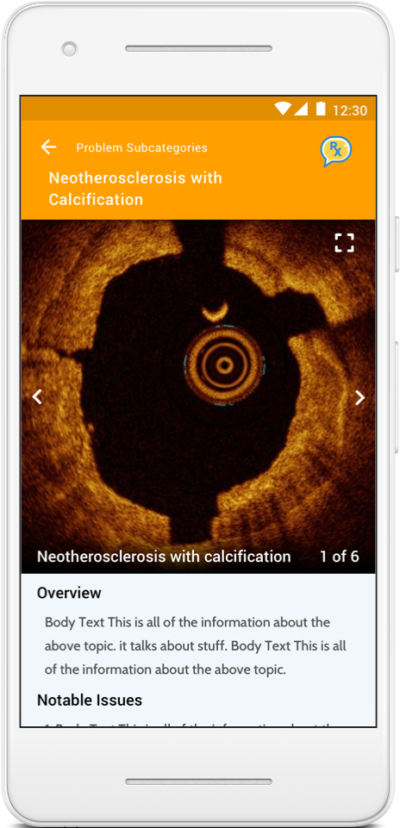
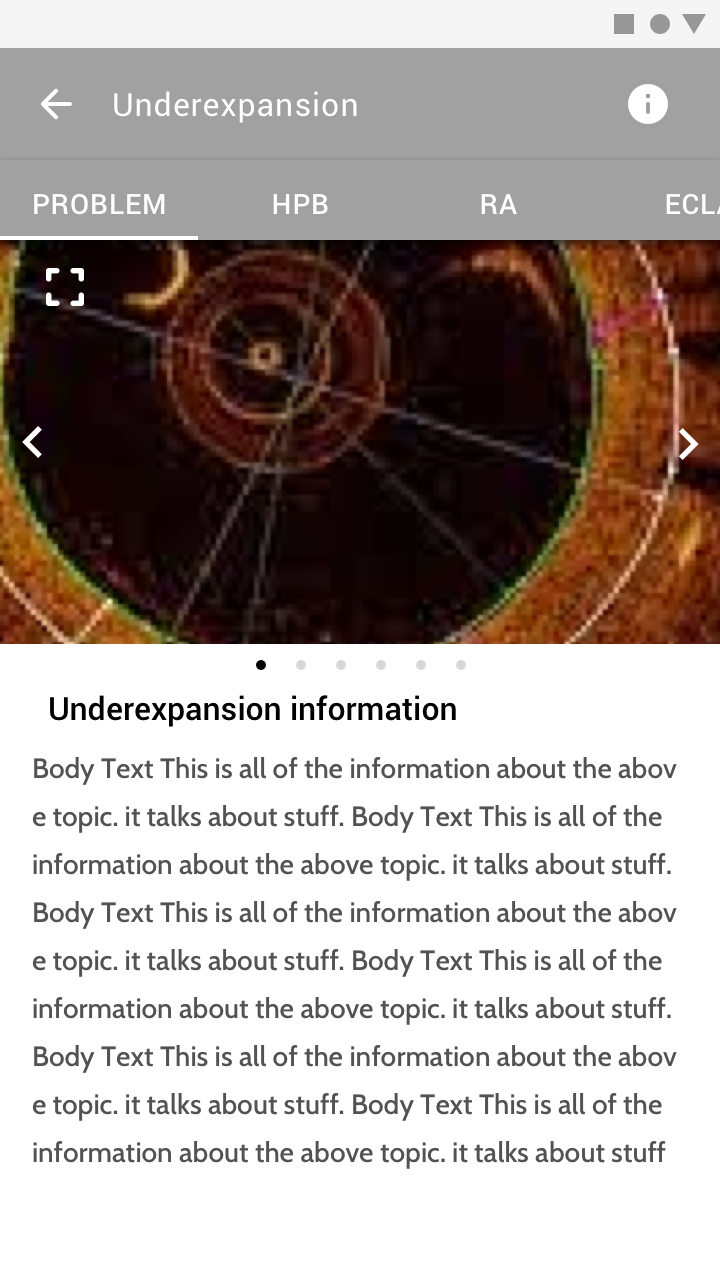
Details of the problem with multiple images and an overview, notable issues, summary for each.
– Treatment icon in upper right hand corner goes to treatments page.
Different type of treatment buttons are not swipe-able but images are.
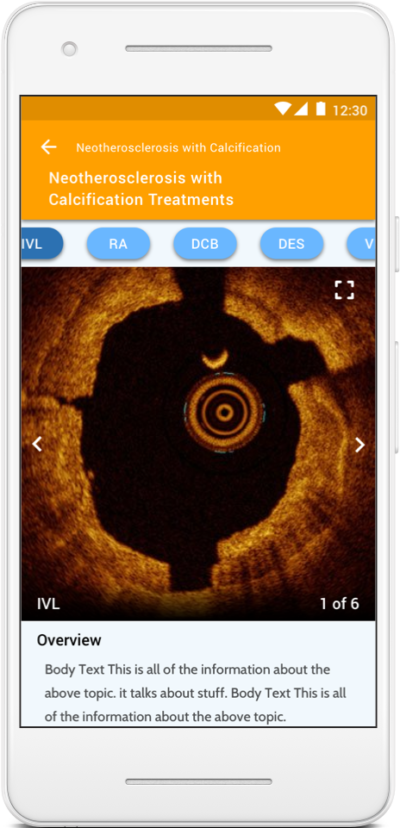
Solution Detail
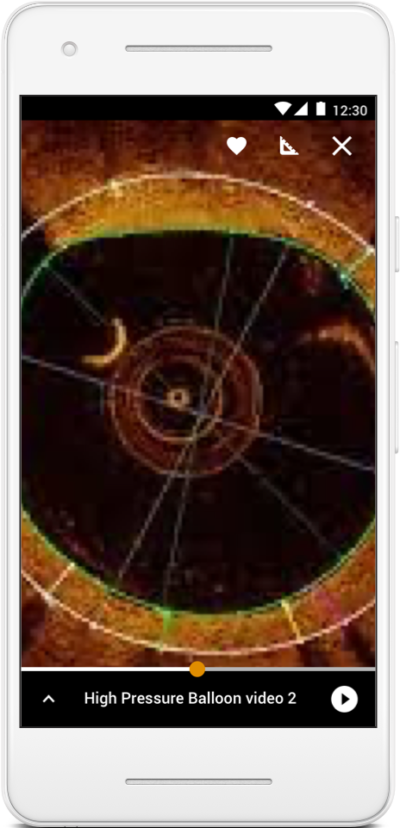
- A large focus for the application is the comparison of images as a base for the information provided.
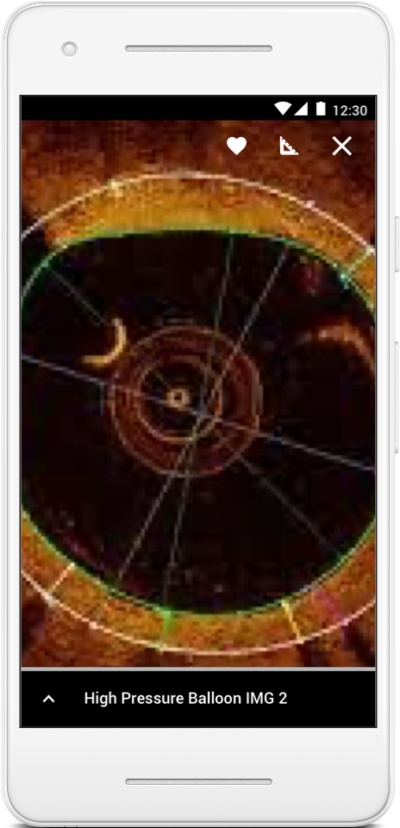
- Users are fully able to pinch zoom and slide to see specific parts of the image in greater detail.
- The annotations provided by Dr. Hashim or by submitting Doctors are also a crucial part of the learning process.
- Every user interviewed expressed how easy it would be to get confused or make false assumptions by something on the screen without annotations.
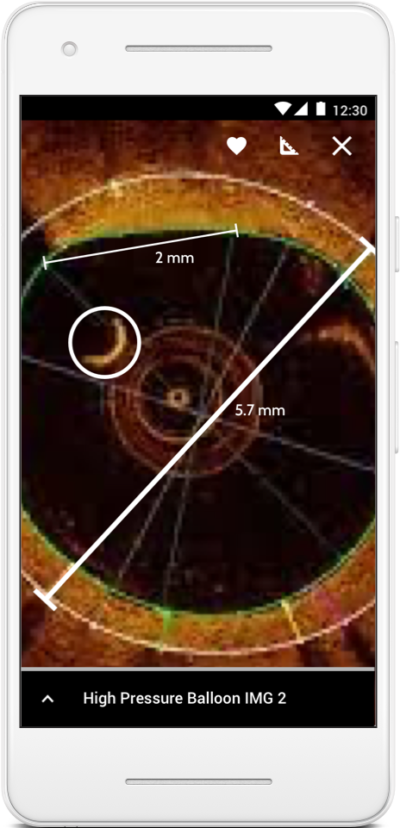
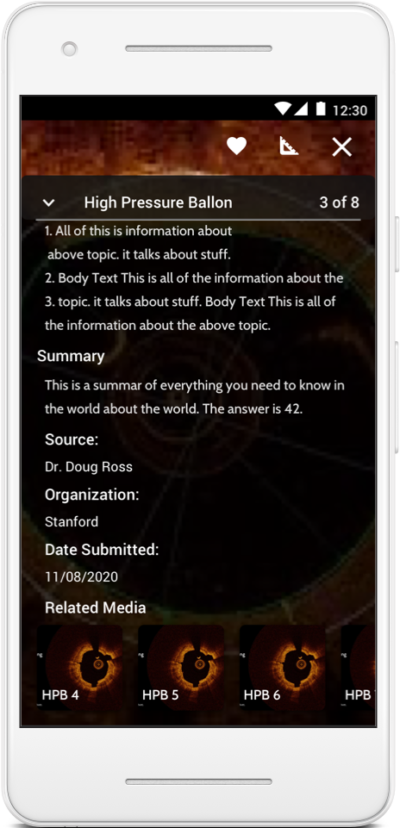
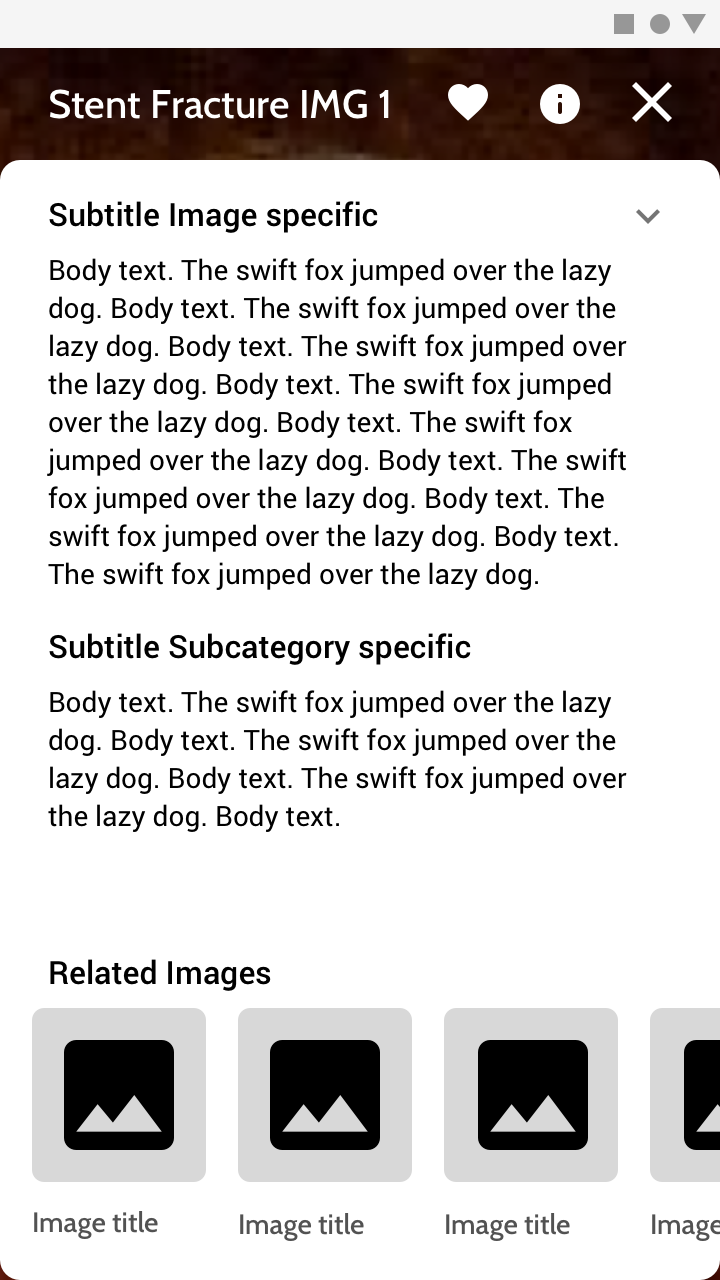
- On the left we can see a detail view of the information for that specific image.
- This would be reviewed by Dr. Hashim prior to being made public but the user who submits receives credit for the post.
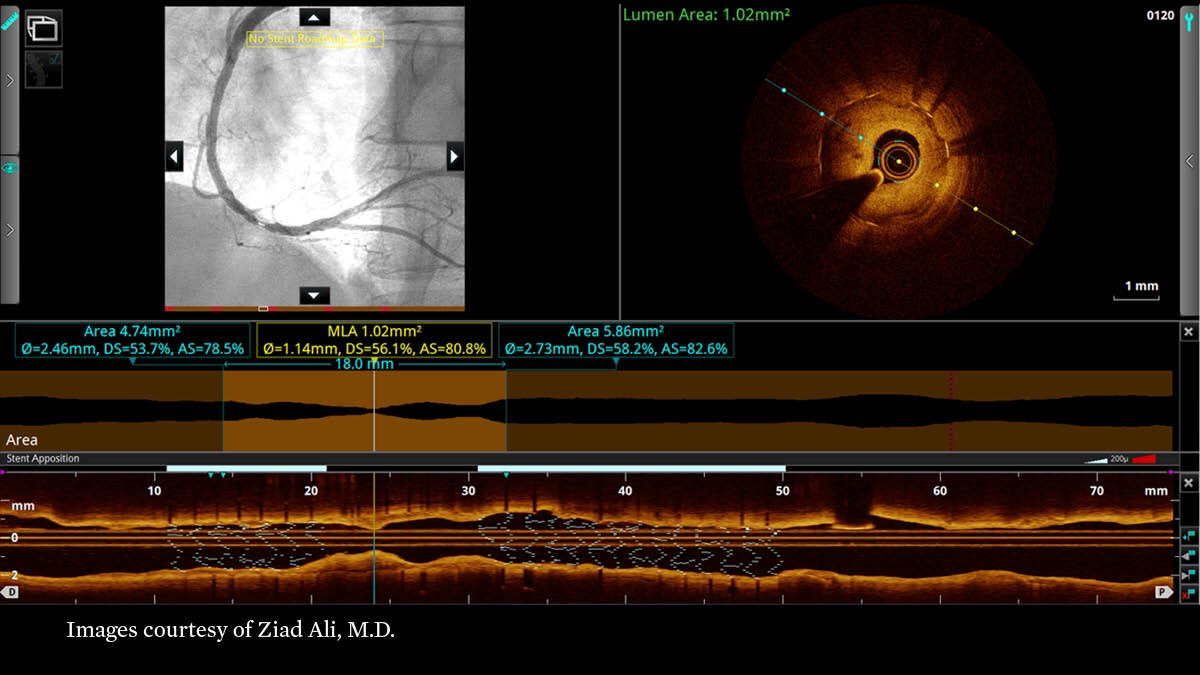
- OCT imagery provides extremely complex imagery and video that is capable of being rendered in 3d.
- Images & video can be viewed in 3d, 2d from an internal view of the artery, 2d from an external side view of the artery.
- We decided on the 2d internal view of the artery as researched indicated it was the most useful for the information we wanted to convey with imagery & video.
Community Uploads
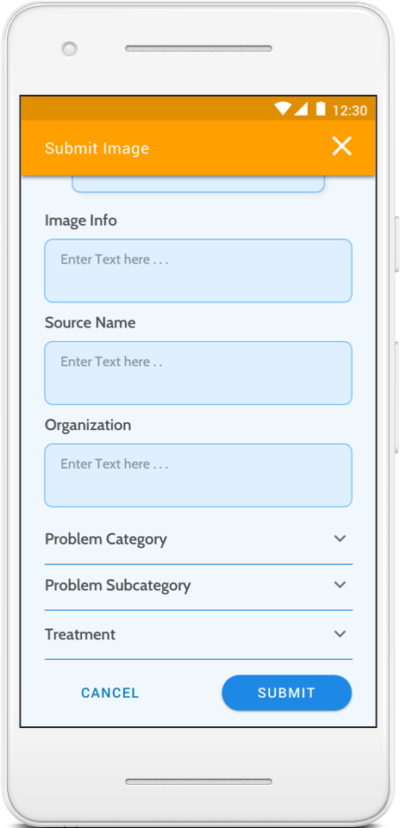
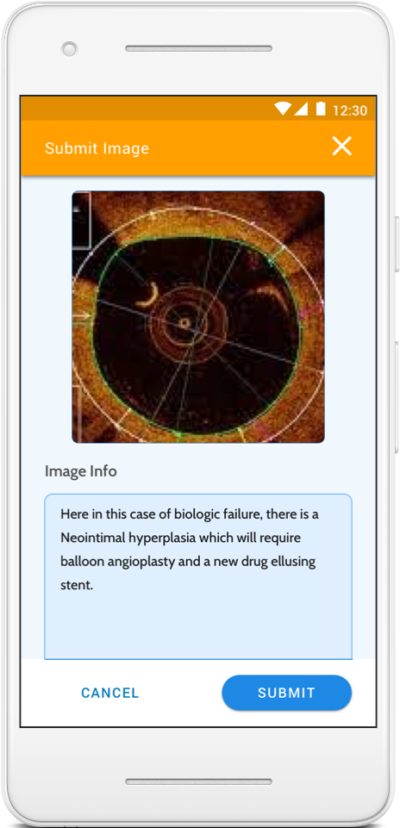
- One of the goals of the application was being able to build community by enabling users to upload their own submissions.
- The form is structured out very clearly in the same format users navigate to treatments.
- Once images are uploaded and data is entered, users will be provided feedback by Dr. Hashim prior to their submission being made public.
Outcomes
Product release coming soon!
Discovery & Strategy
THE DESIGN DASH
We were extremely fortunate to be able to get 6 hours of Dr. Hashim’s time over the first two days of our Design Dash. Due to his expertise and the scarcity of his skills and knowledge his time was extremely valuable. Because of this, I put together what I would call a “Design Dash.” It is very similar to a “Design Sprint,” the main difference is that workshop exercises are modified to take less time in exchange for less discovery & questions about what the correct problem actually is to be solving.
– Discovery Questions – Sent to client before hand to get them thinking.
– User Persona Defenition
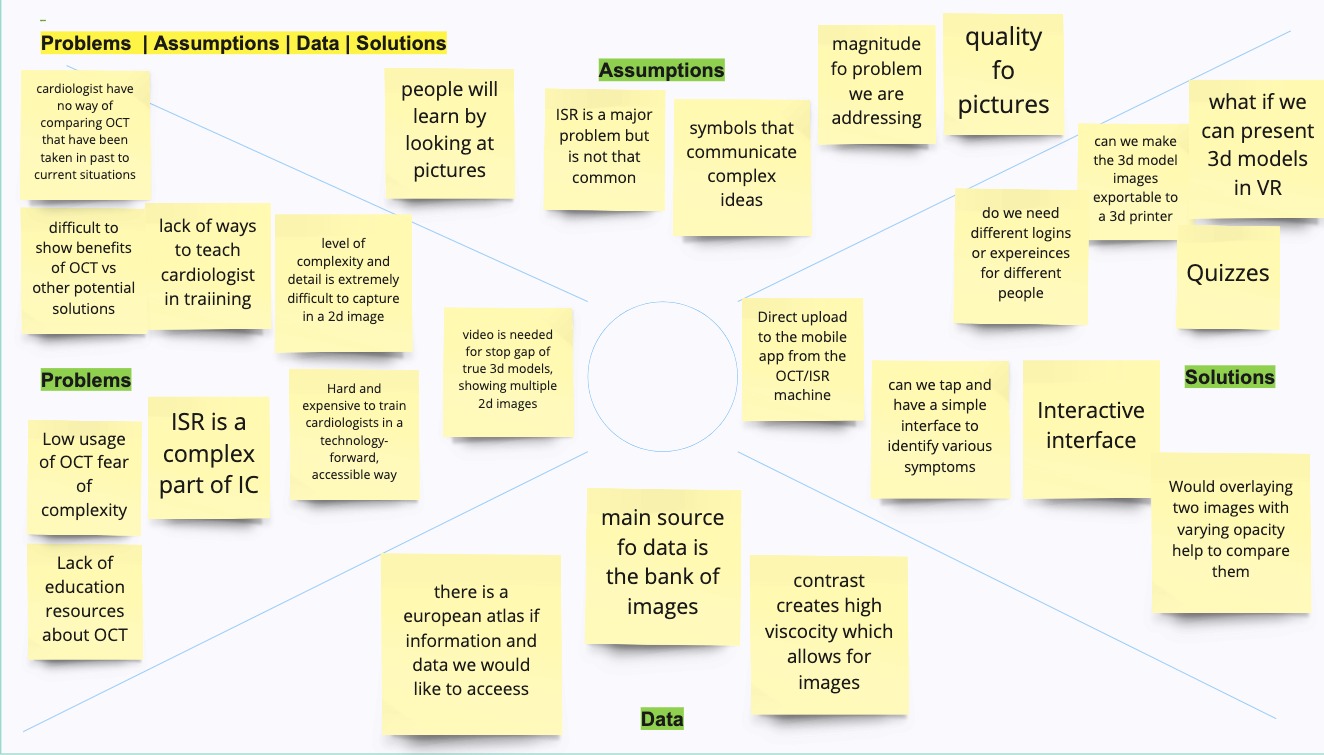
– PADS: Problems, Assumptions, Data, Solutions
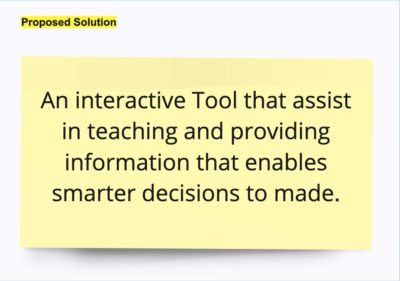
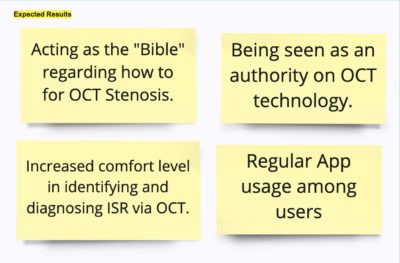
– Hypothesis: Problem, Solution, Expected Result
– Long Term Goals
– User Journey Mapping
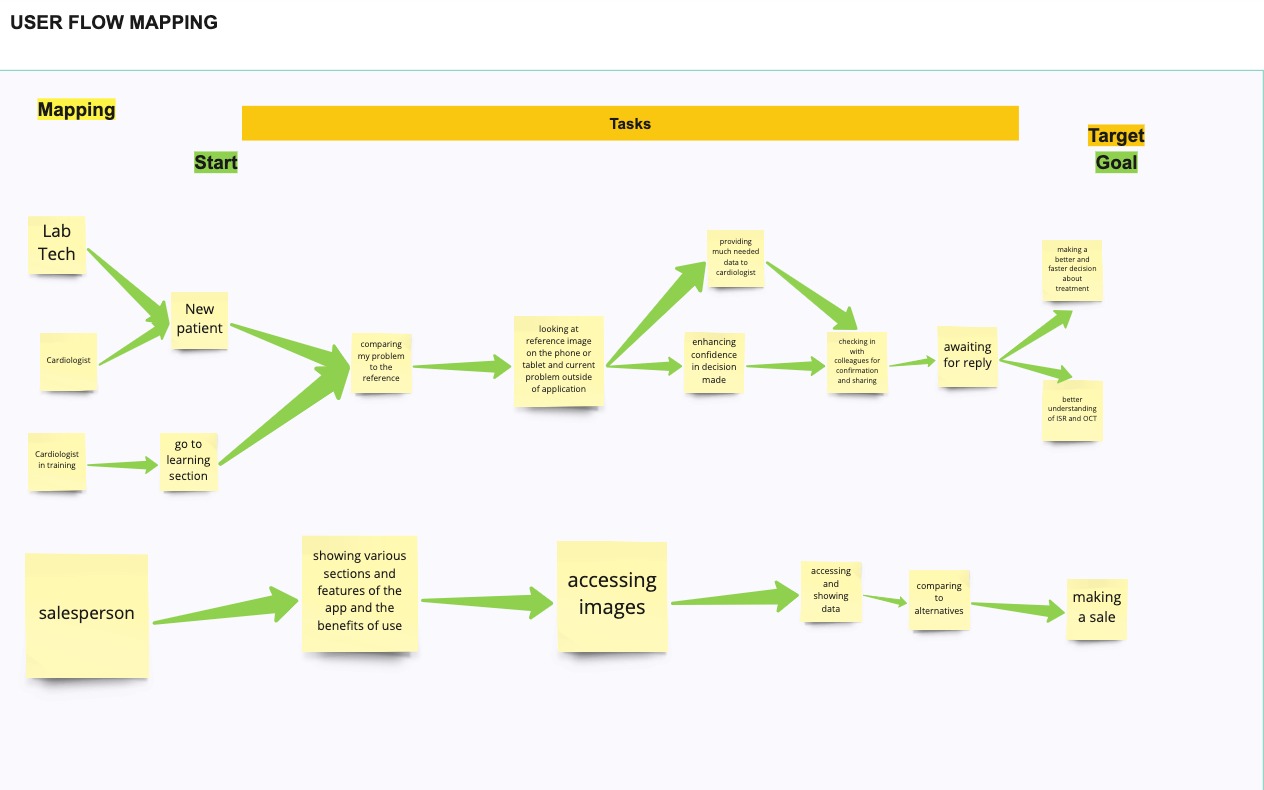
– User Flow Mapping
– Like It, Hate It: Liked or hated software based on experience or aesthetics.
– Finding Our Center: Team and client vote on priorities and jobs to be done.
Problems, Assumptions, Data, Solutions (PADS)
The PADS exercise provides an easy and efficient way to for the team to gather information from the stakeholder. It can also at times lead to the stakeholder questioning some of their assumptions. I find it best used when the stakeholder is very clear in their own mind about what they want. Some exercises in a design sprint that would normally be used at this time can not be as helpful or as efficient depending on circumstances.
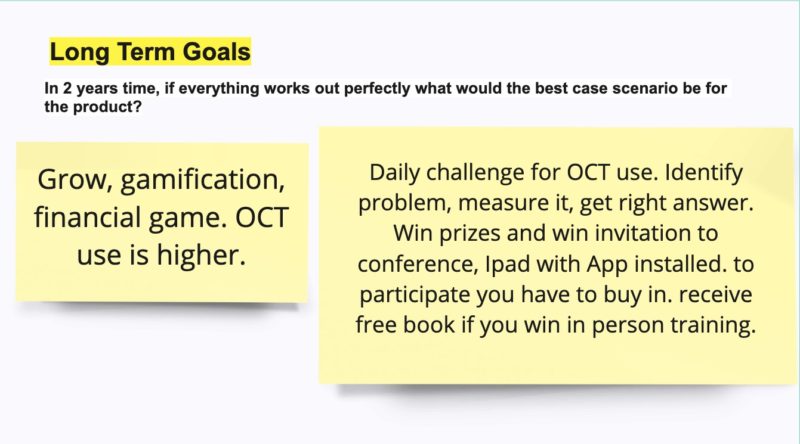
Long Term Goals
Definition & Research
Target Demographics Information
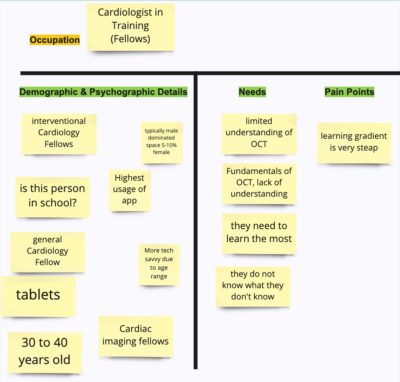
Cardiologist are the primary user for the application. They want themselves and their assistants to be able to make decisions with surety.
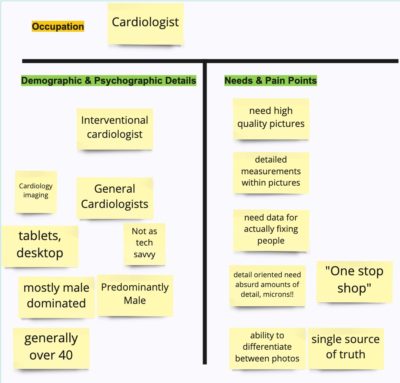
Cath Lab Technologist are just as important as the Cardiologist because they work as part of a team. They assist in using the machine and providing valuable information to the doctor.
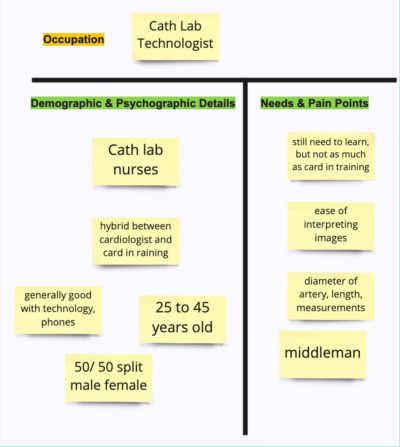
Cardiologist in training are becoming the doctors that will be saving peoples lives. While they may utilize the app more often their sense of urgency and need for accuracy is no where near our other two users.
Analysis & Ideas
Moving Forward!
After gathering data from the stakeholders and from our research. We were able to identify the following opportunities.
– Search would have limited use because many users would not even know what to look for.
– Enabling users to easily flow from a larger problem category, down into a specific problem, and then into solutions for that problem and detailed information within the solution was critical to app success.
– Oversized images where the user can zoom in and explore images in great detail along with annotations would be an amazing aid to the learning process.
– While OCT imaging is amazingly sophisticated we were unable to fully utilize the technology at this time but plan to do so in the future.
Despite having multiple users, flows for each user would be similar enough it was not an option to design or develop specific user flows outside of the main user flow. The primary goal of the application was to teach and for users to learn and help others learn.
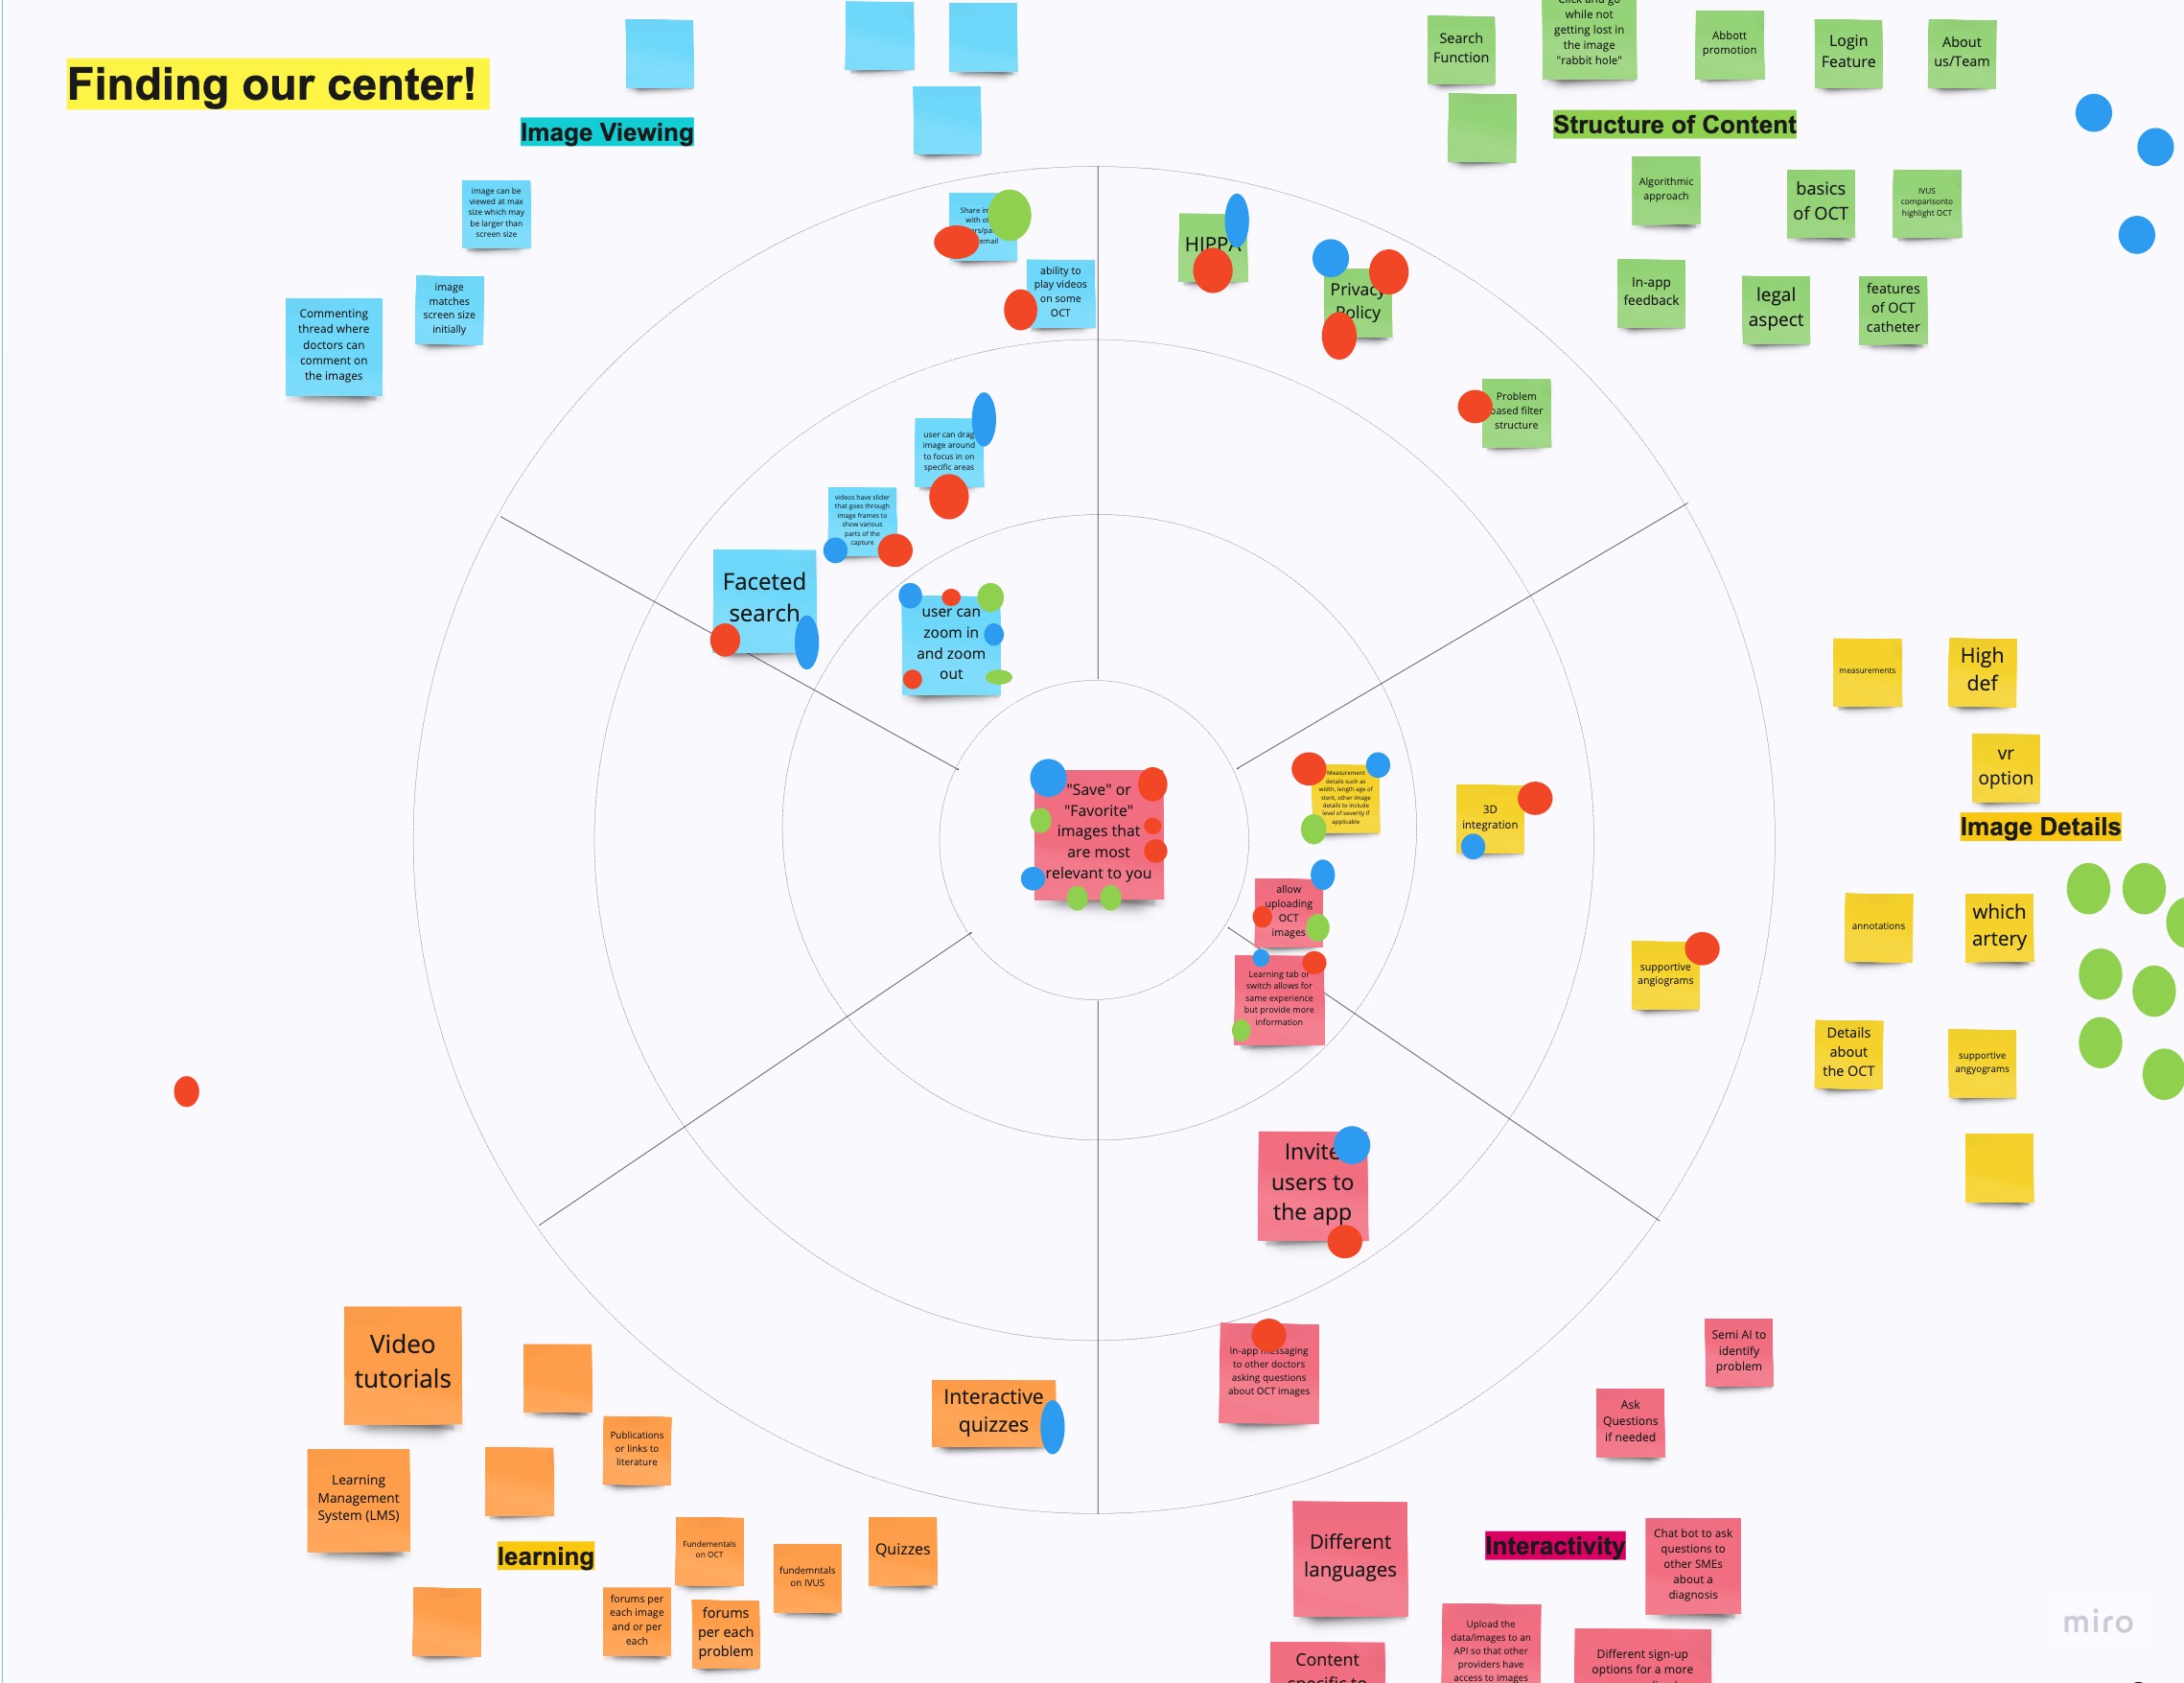
Most clients that are unfamiliar with software design and development have a difficult time prioritizing the different tasks that need to be accomplished by the software. This exercise involves the team, is fun but still gives the stakeholder all of the power to make the decisions they need to.
Design & Iteration
Previous Design Example
- My initial focus for the design was finding a way to implement and structure the information I had about OCT and ISR for optimal learning. This was a challenge because:
– I did not have access to all the information.
– The topic was niche and specialized so outside sources of information were extremely limited.
- The client required a specific layout for certain pages.
– Making the overall design and structure of content work while keeping these in place was a challenge.
Iterate as you discover!
Working with no content about a topic where the content is specific and there is no room for error was not simple.
My time with Dr. Hashim was limited so I found it helpful to enter each meeting with multiple options but also to be able to mockup quick wire frames on the go as I picked up pieces of information.
Implementation & Collaboration
Staying Lean and bringing Value
Similar to many projects, hours on this project were tight. Our team wanted to deliver the most value to the client as possible within the time frame allotted. When the project started out I was the PM and the sole designer so it was my job to work with the client to define priorities. What was table stakes, what else was needed and what was nice to have. The biggest want for the project that we did not know if were would be able to implement was video. If it had just been regular video then this would have been simple, but OCT video is not simple.
Evaluation & Observation
USERS
– The original SOW did not include user testing or user research.
– It did not include a prototype but after speaking with Doctor Hashim he agreed to reach out to 1 of each of main audiences.
– Understandably this is a small sample size but it is significantly better than zero. This included:
— Cardiologist
— Cardiologist in Training
— Cath Lab Technologist
WINS
– Agreement on structure of information.
– Excitement about community uploads.
– Discovery that square images / video will work best for content.
– All users like the idea of favorites or saved.
– All users like video with slider concept.
DESIGN SPRINT PROTOTYPE QUOTES
“Can I do an image search and match it to others in the database? So I take a picture and it tells me what is wrong?”
“Will there be a glossary to search abbreviations and keywords?”
“Can I cast this to another screen?”
“I love the annotated view.”
“Many Doctors are uncomfortable treating these issues right now. They need to get comfortable with the technology and treatment. Would it be possible to show the angiogram as well?”
“Are we gonna be able to have patient data to go along with each image? Like 40 year old, male, overweight, diabetes etc . . ?”
TAKEAWAY
The users we tested with understood how the information was structured and were easily able to navigate through the prototype. There were a few features and pieces of information they wanted that we had not thought of or were simply not going to be able to provide such as patient data. They were also very excited for what could be and had a ton of ideas for the future which were added to the product backlog.
Conclusion
Quick iteration is extremely helpful.
The biggest challenges for this project were:
– Less than an actual week of work.
– Extremely little content, information or data made it difficult to build an optimal learning structure for the data.
– Specific pages required to be laid our and look a certain way.
Creating screens quickly and getting immediate feedback while we were in meetings was extremely helpful. It did make some of our meetings last longer but overall it took much less of everybody’s time.
If I could change one thing about this project, it would be that I would want to have significantly more information and data surrounding the topic prior to moving forward.
