Project Description
Argo Nav

Introduction
Business Problem
– The client has a technology for analyzing and updating bathymetric (depth) data but no way to gather the data.
– Current data sets are extremely old and unreliable.
– The process is expensive.
– Gathering accurate depth data needs a large number of people collecting data on a regular basis.
User Problem
- Current apps in the space are repeats of chart plotters based on complex navigational charts.
- Our research indicated these are too complex for the typical recreational boater.
- Recreational boaters just want to know how to get from point A to point B safely.
- Users expressed there is no source of live information available regarding conditions on the water.
Solution
The solution is a mobile, social application for boaters that keeps them safe as they travel on the water and helps them plan voyages and share information.
Success Metrics
- # of downloads
- # of completed voyages
- # of pins dropped
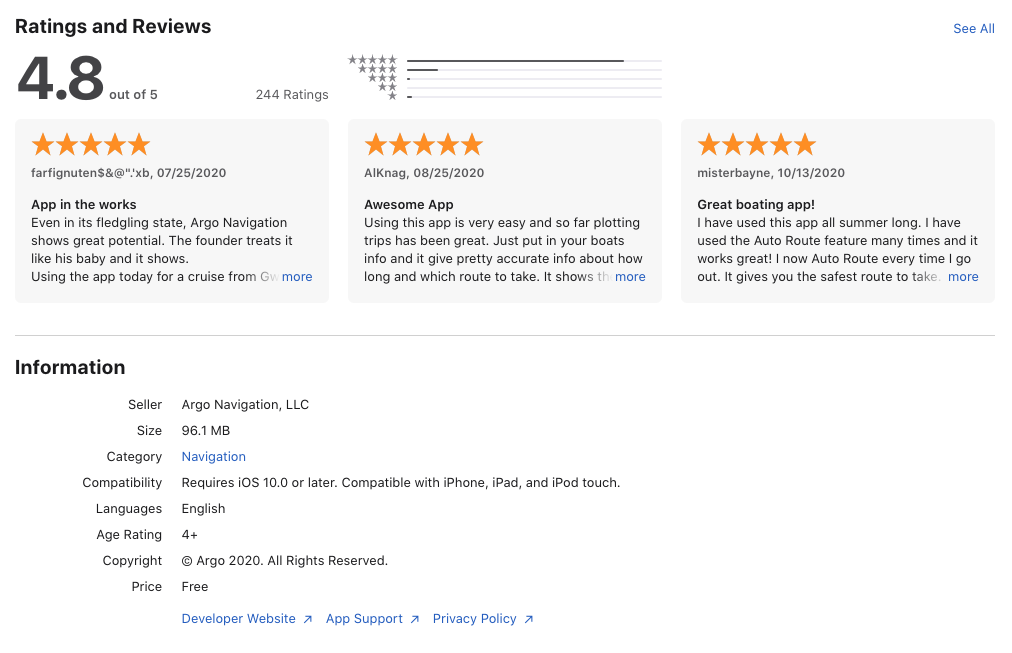
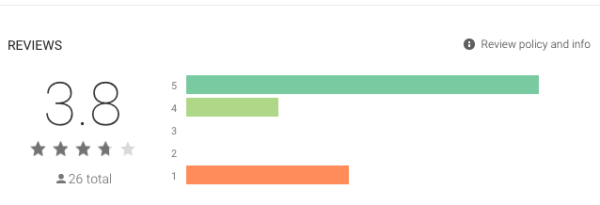
- App rating on the App Store & Play Store
Expected Result
- Recreational boaters will simply get from point A to point B safely.
- On the water navigation cheaper than a chart-plotter
- Ability to eventually collect accurate bathymetric (depth) data.
- Helps keep people safe.
- Can be monetized.
Logistics
Scope
The project started out with market & user research. Then testing a prototype with users in a 2-week design sprint. After that the MVP build was set for 3 months. The project has been going on for over a year with features being added and improved on a regular basis.
My Role
- Lead Designer > trained up and transferred majority of UX work to team member.
- Initially Product Manager >passed on to team member.
- Product Strategy Consultant – ongoing.
Team Make Up
| Team Role | Hours / Sprint | Total Hours |
|---|---|---|
| Product Manager | 40 | Ongoing |
| UX Designer | (40 start) current 20 | Ongoing |
| Front End Dev | 80 | Ongoing |
| Back End Dev | 80 | Ongoing |
| QA | 20 | Ongoing |
Solution
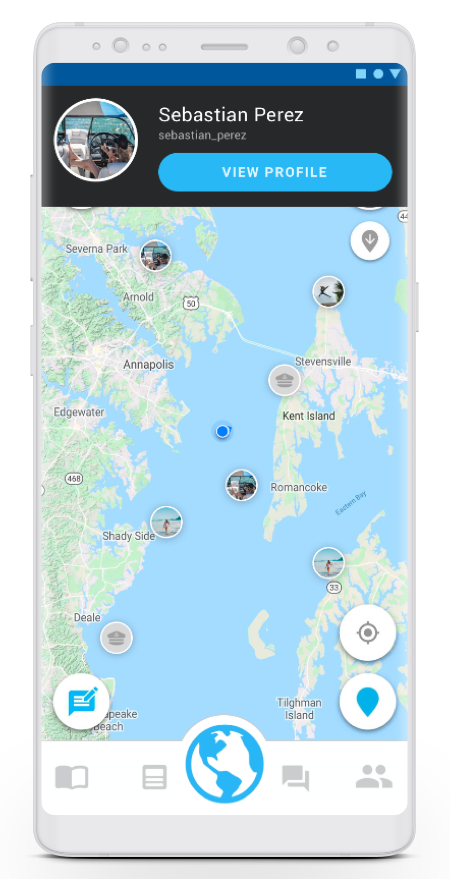
Who and What?
How we are addressing two of the main problems users are facing.
- Who (which of my friends) is on the water right now?
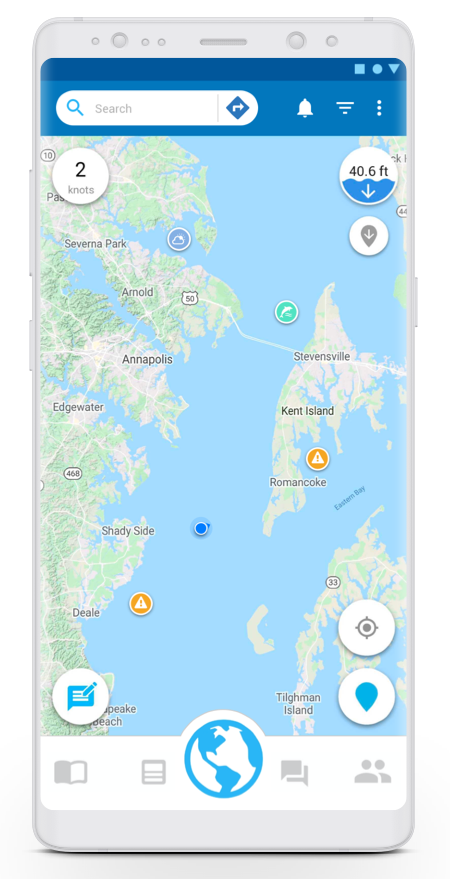
- What do I need to know? (safety)
- What is interesting to know?
- Where might I want to go?
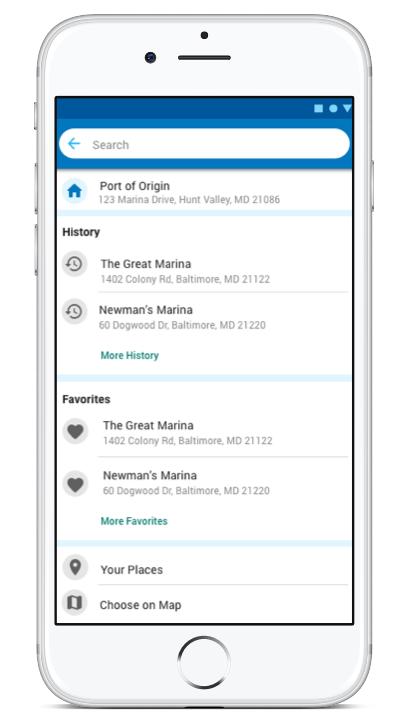
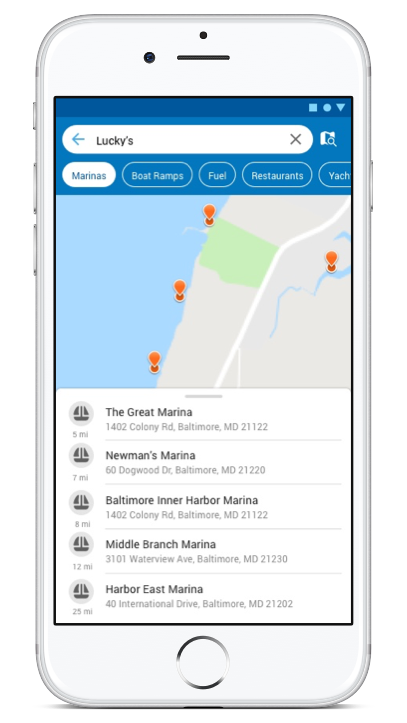
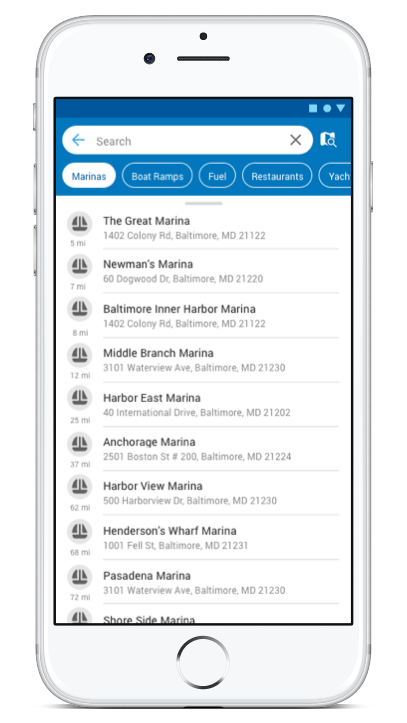
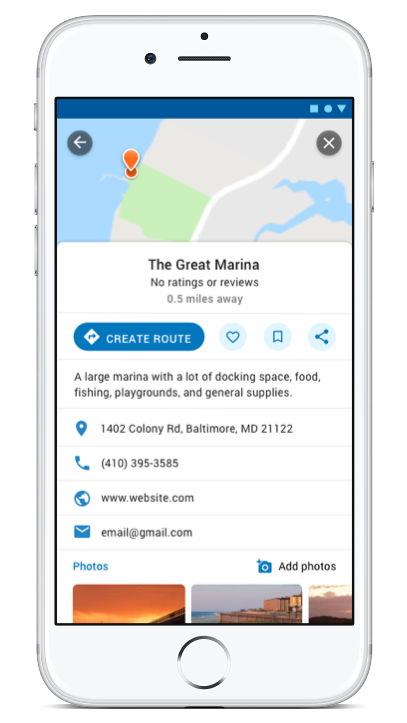
Search
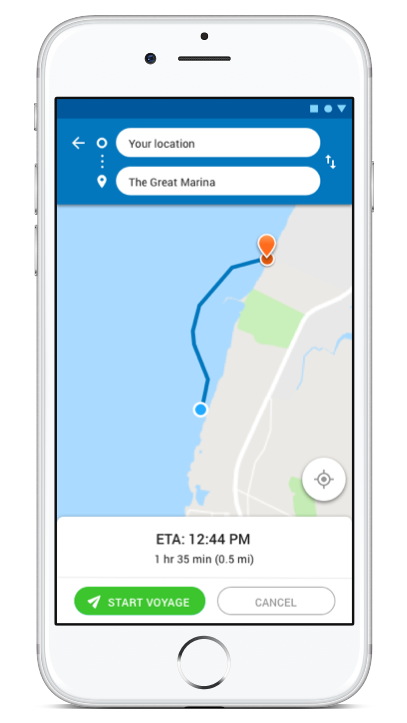
We set out to offer users an experience they were familiar with. One Similar to Wayz or Google Maps.
Some of the interesting challenges we had included:
- Filtering Search results accessible by water.
- Where is the users start location?
- Our goal is to keep them out of shallow water, but this is where most people start a voyage from!
- Many of the Marinas and other locations boaters frequent were not up to date. After verifying our own data, we created the ability to crowdsource that data.
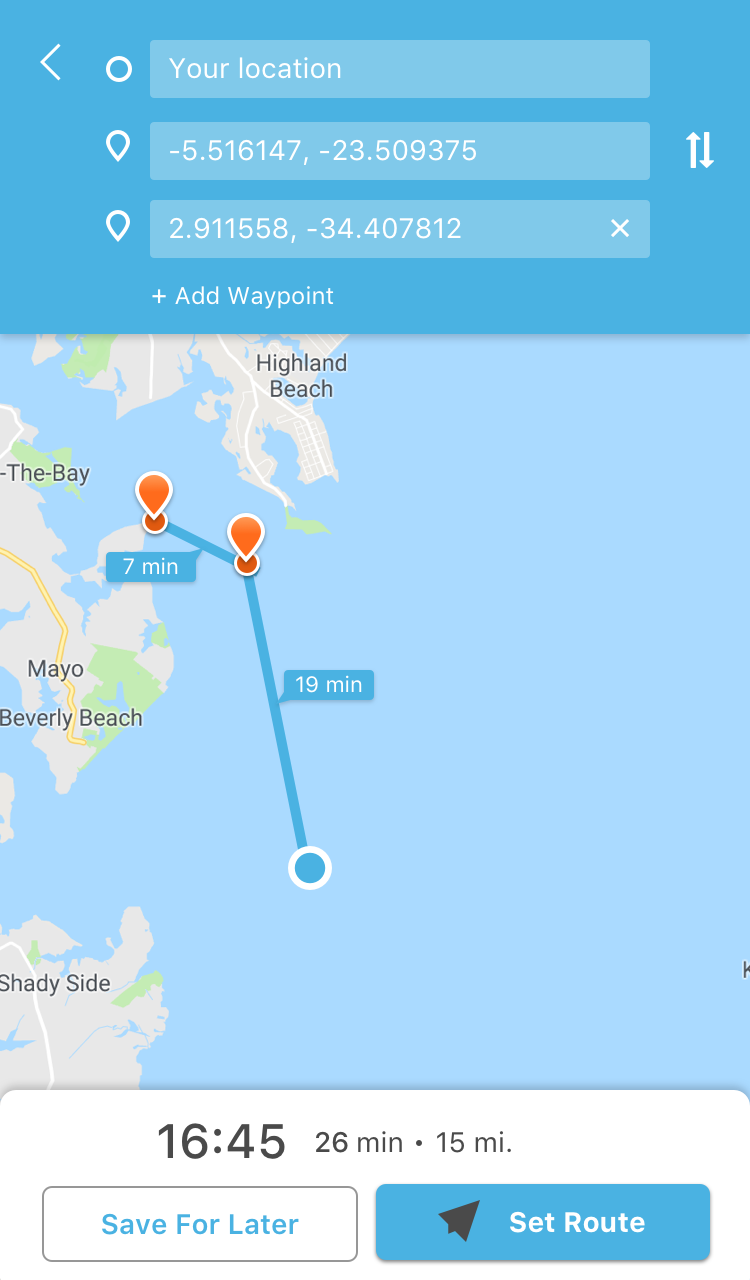
There are no roads to follow on the water. To start we kept it simple and let people follow the route!
Discovery & Strategy
THE BEGINNING
- The original scope of the project was only 3 months.
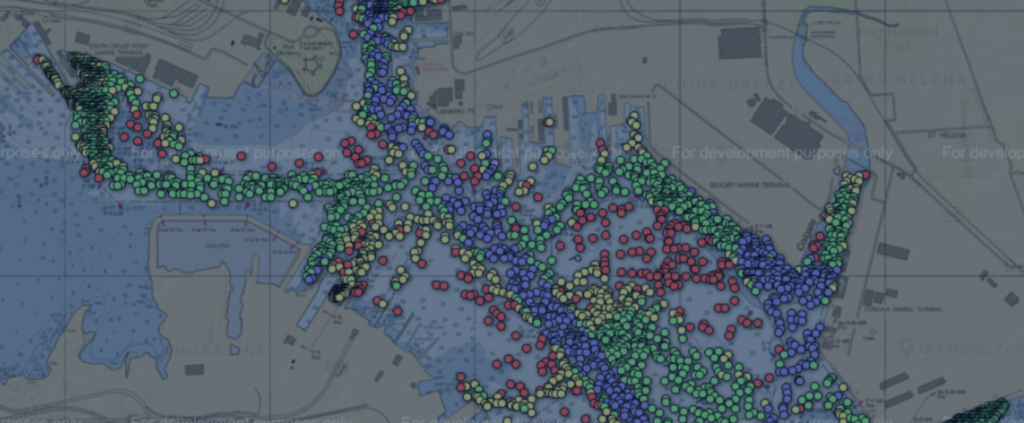
- During interviews the client was very clear in his desire to have a social app where users could upload depth data.
- In exchange for the data provided by users the basic version of the app would be free.
- To the right you can see a visualization of what that data looks like.
TECHNICAL IMPACTS ON DESIGN
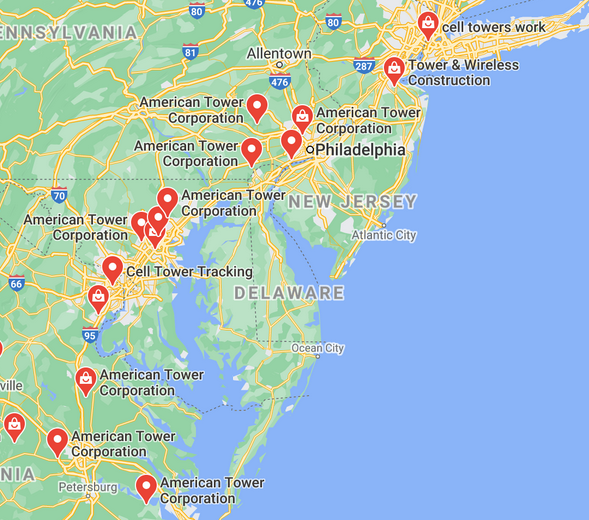
Cell towers are placed to have coverage where the most people are. There is no point in them putting out signal over the water. If you head out or into open water you will lose your cell service but not necessarily your GPS which can rely on satellite data. Our research indicated that the majority of recreational boaters stayed very close to the coast and did not venture out into “open water.” This had a huge impact on how we designed and built the product. By having our map system and routing system run from the server as opposed to being in the app and on the device, we were able to save the client an immeasurable amount of time and money. We knew that this would at times impact the user experience and accounted for it through messaging and loading animations.
Target Market Information
- Over 87 million Americans go boating at least once a year.
- Boating is typically for the middle class with 71.5% of people making less than $100,000 per year.
- Sailors, persons with large boats and yacht owners are a small percentage of the target demographic.
30% of boaters are 25 – 44 years old.
27.5% are between 45 and 65 years old.
95% of boats on the water in the U.S.A are power boats less than 26 feet in length.
54% of those are between 26 and 15 feet in length.
65% of boat owners are likely to go fishing from their boat once a year.
Definition & Research
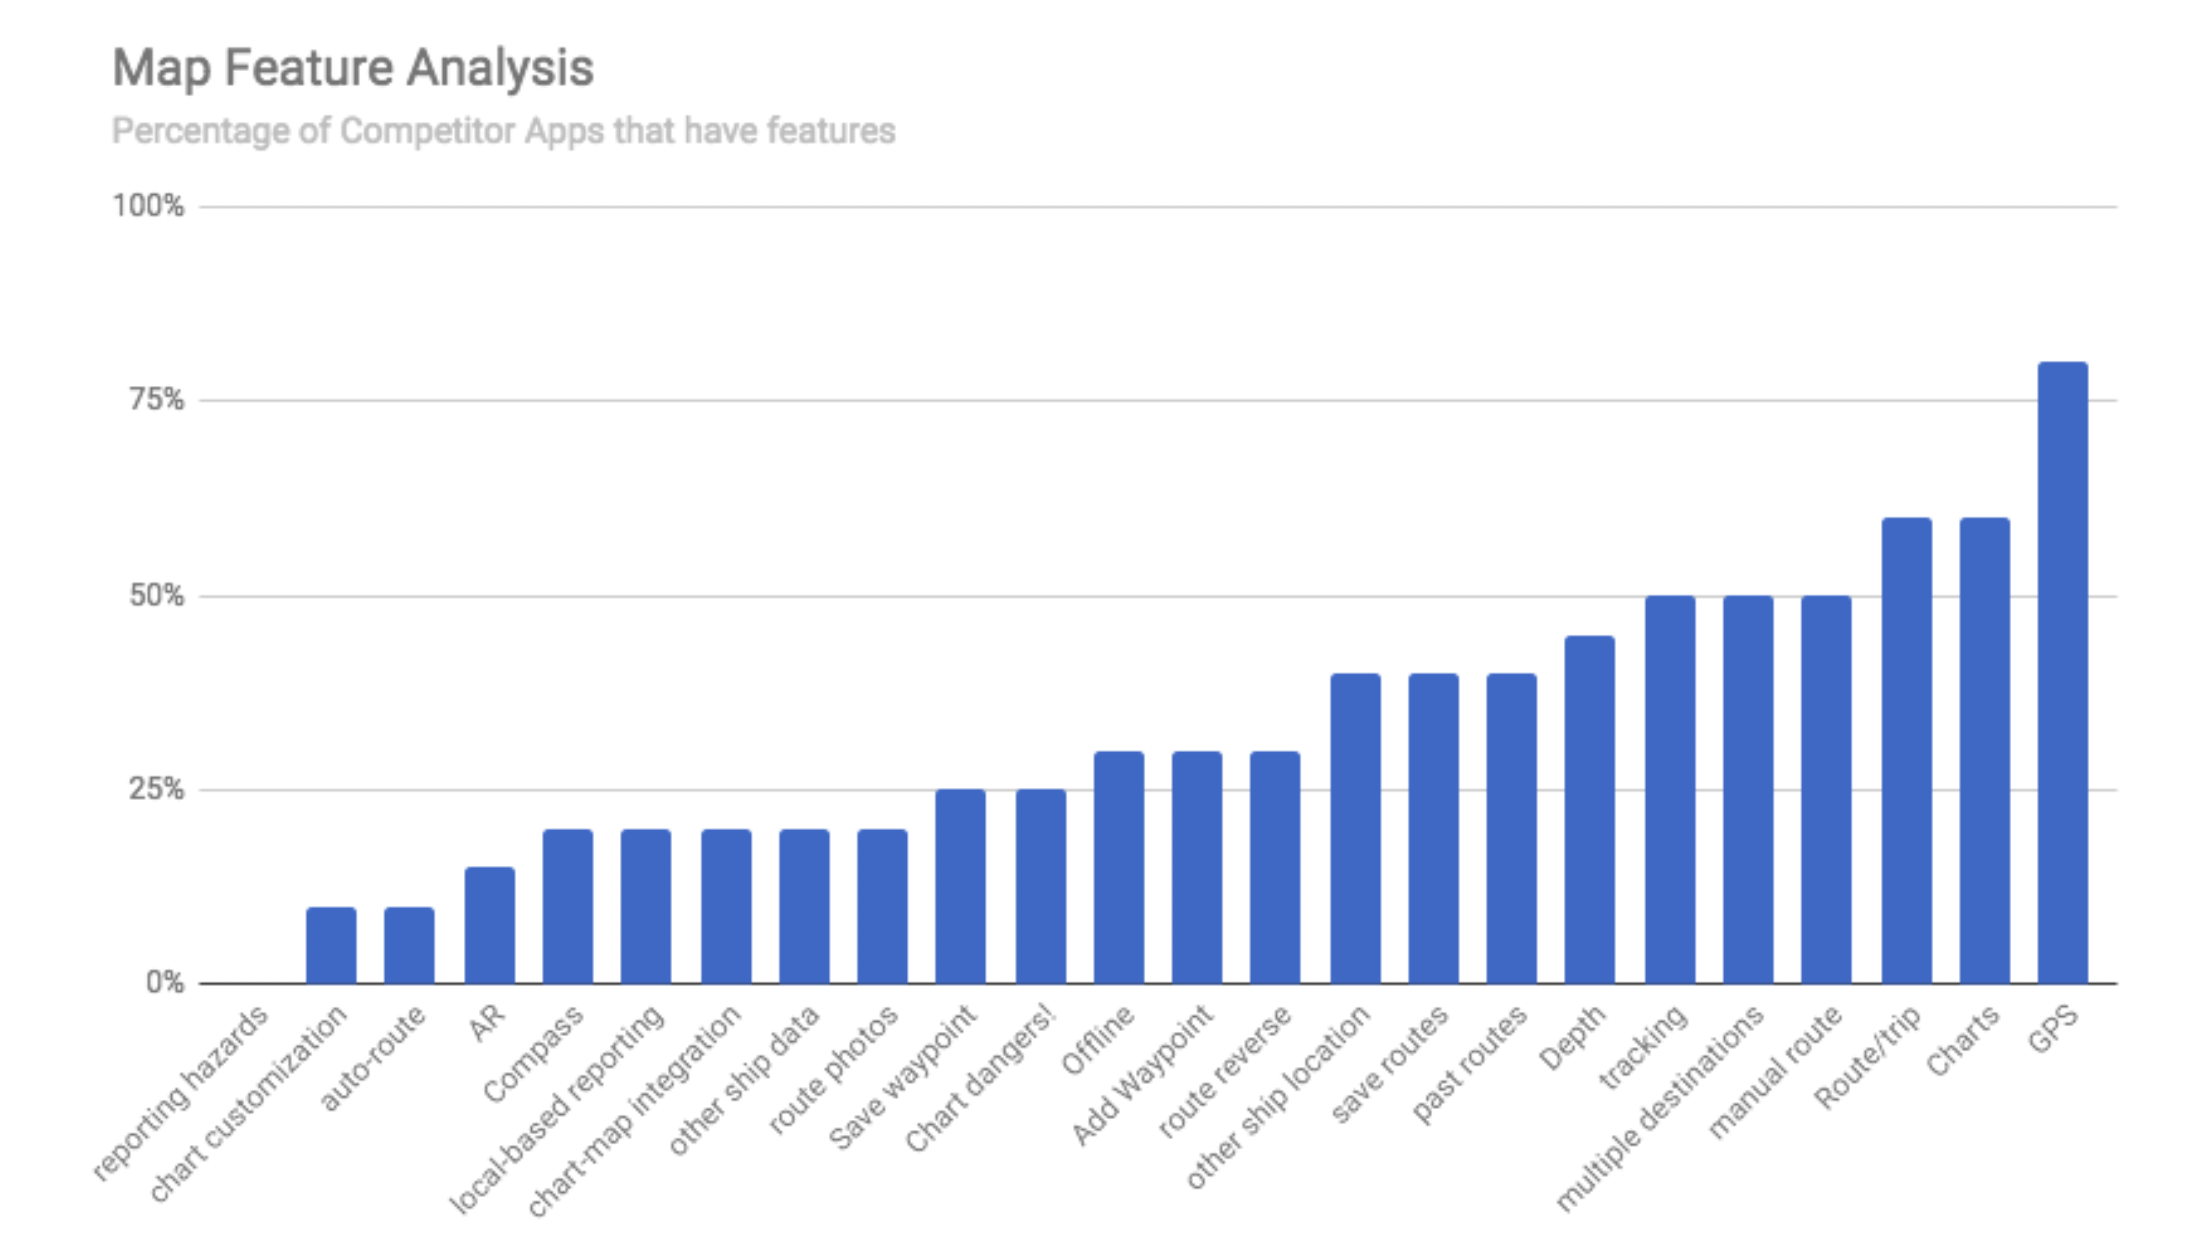
When looking at the apps in the space, there is a specific trend towards certain features. We used this data to inform the questions we asked users and found that their actual need was just getting from point A to B safely and that they did not have a need for fancy or complex charts.
Why does it matter?
- Understanding how frequently boaters go out on the water gave us an idea of how often they would use the app.
- Many boats come with chart-plotters, gathering information about those devices and their use was vital.
- A qualitative piece of information we gathered was that a majority of boaters would interested in finding other boaters with similar interests.
- This implied a need to socialize that was not being fulfilled.
68% of boaters belong to a boating social group.
44% of boaters interact with this group once a week or more off the water.
32% of boaters interact with this group once a week or more on the water.
40% of boaters get out on the water more than once a week.
40% of boaters do not use any type of chart-plotter.
GPS and depth are the most common features in boating apps.
These jobs can be accomplished by chart-plotters, but many chart-plotters are difficult to set up, difficult to use, and difficult to see in the bright sun. In addition, these charts do not provide the best experience for recreational users. Considering the advances of modern technology, and that these charts were originally conceived in the 13th century specifically for navigation around the poles. In addition, there have been no improvements to charts since 1965.
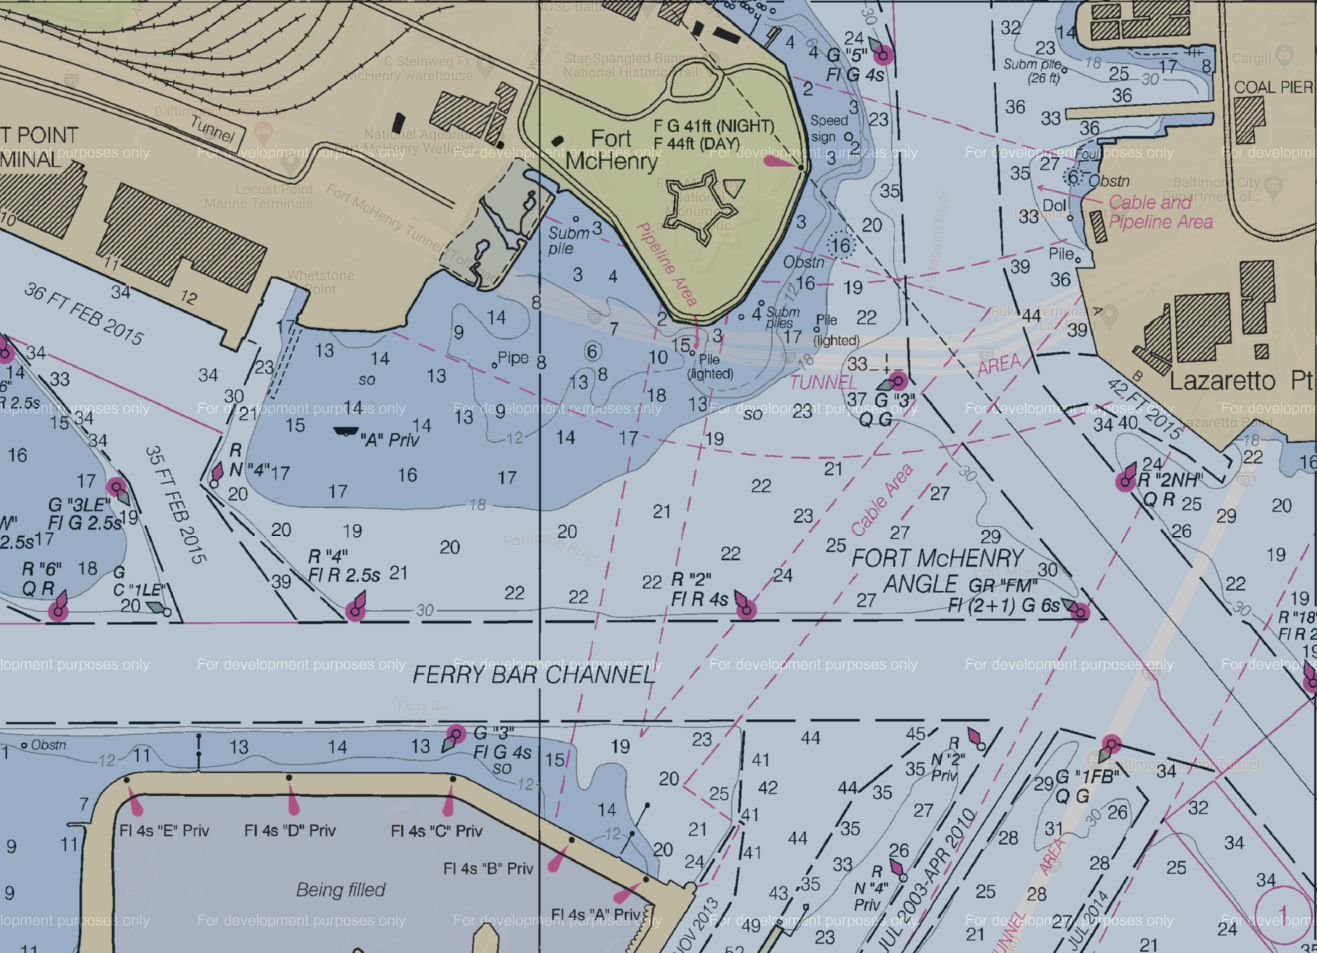
Analysis & Ideas
How does a 3d mesh help you get from here to there?
The image to the right is colored based off a 3d mesh created from depth data. Due to the inconsistent nature of depth data, a 3d mesh enabled our team to estimate areas where there was no data and easily make adjustments over time based on aggregate data. If we have an area that is void of data, we can utilize the surrounding depth data to estimate the depth of various points within that area. Note (not what users see in app.)
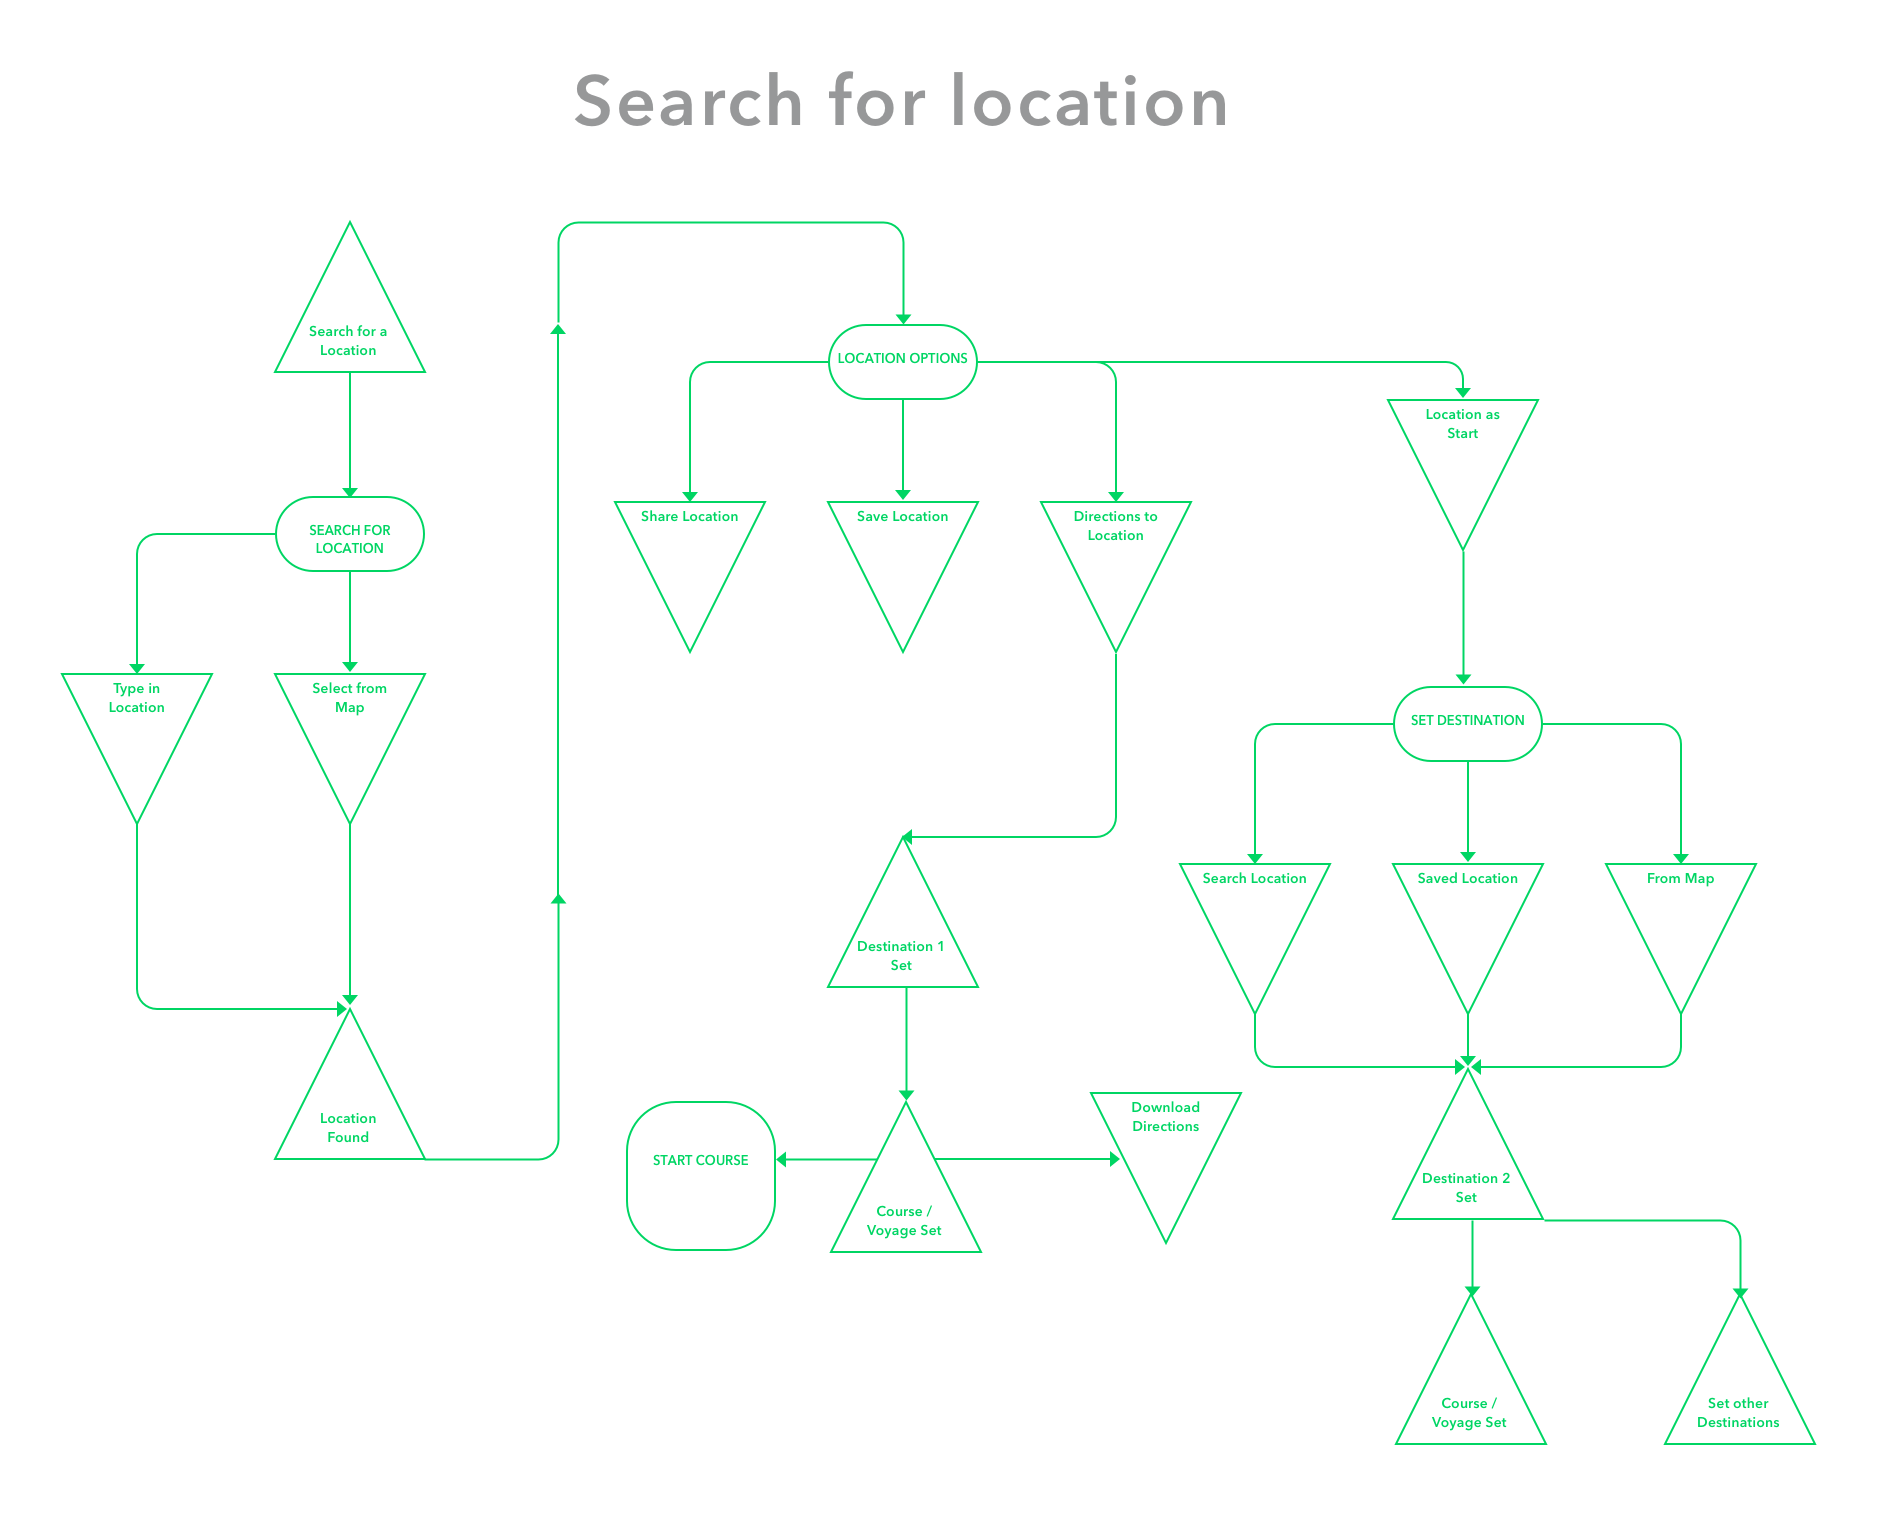
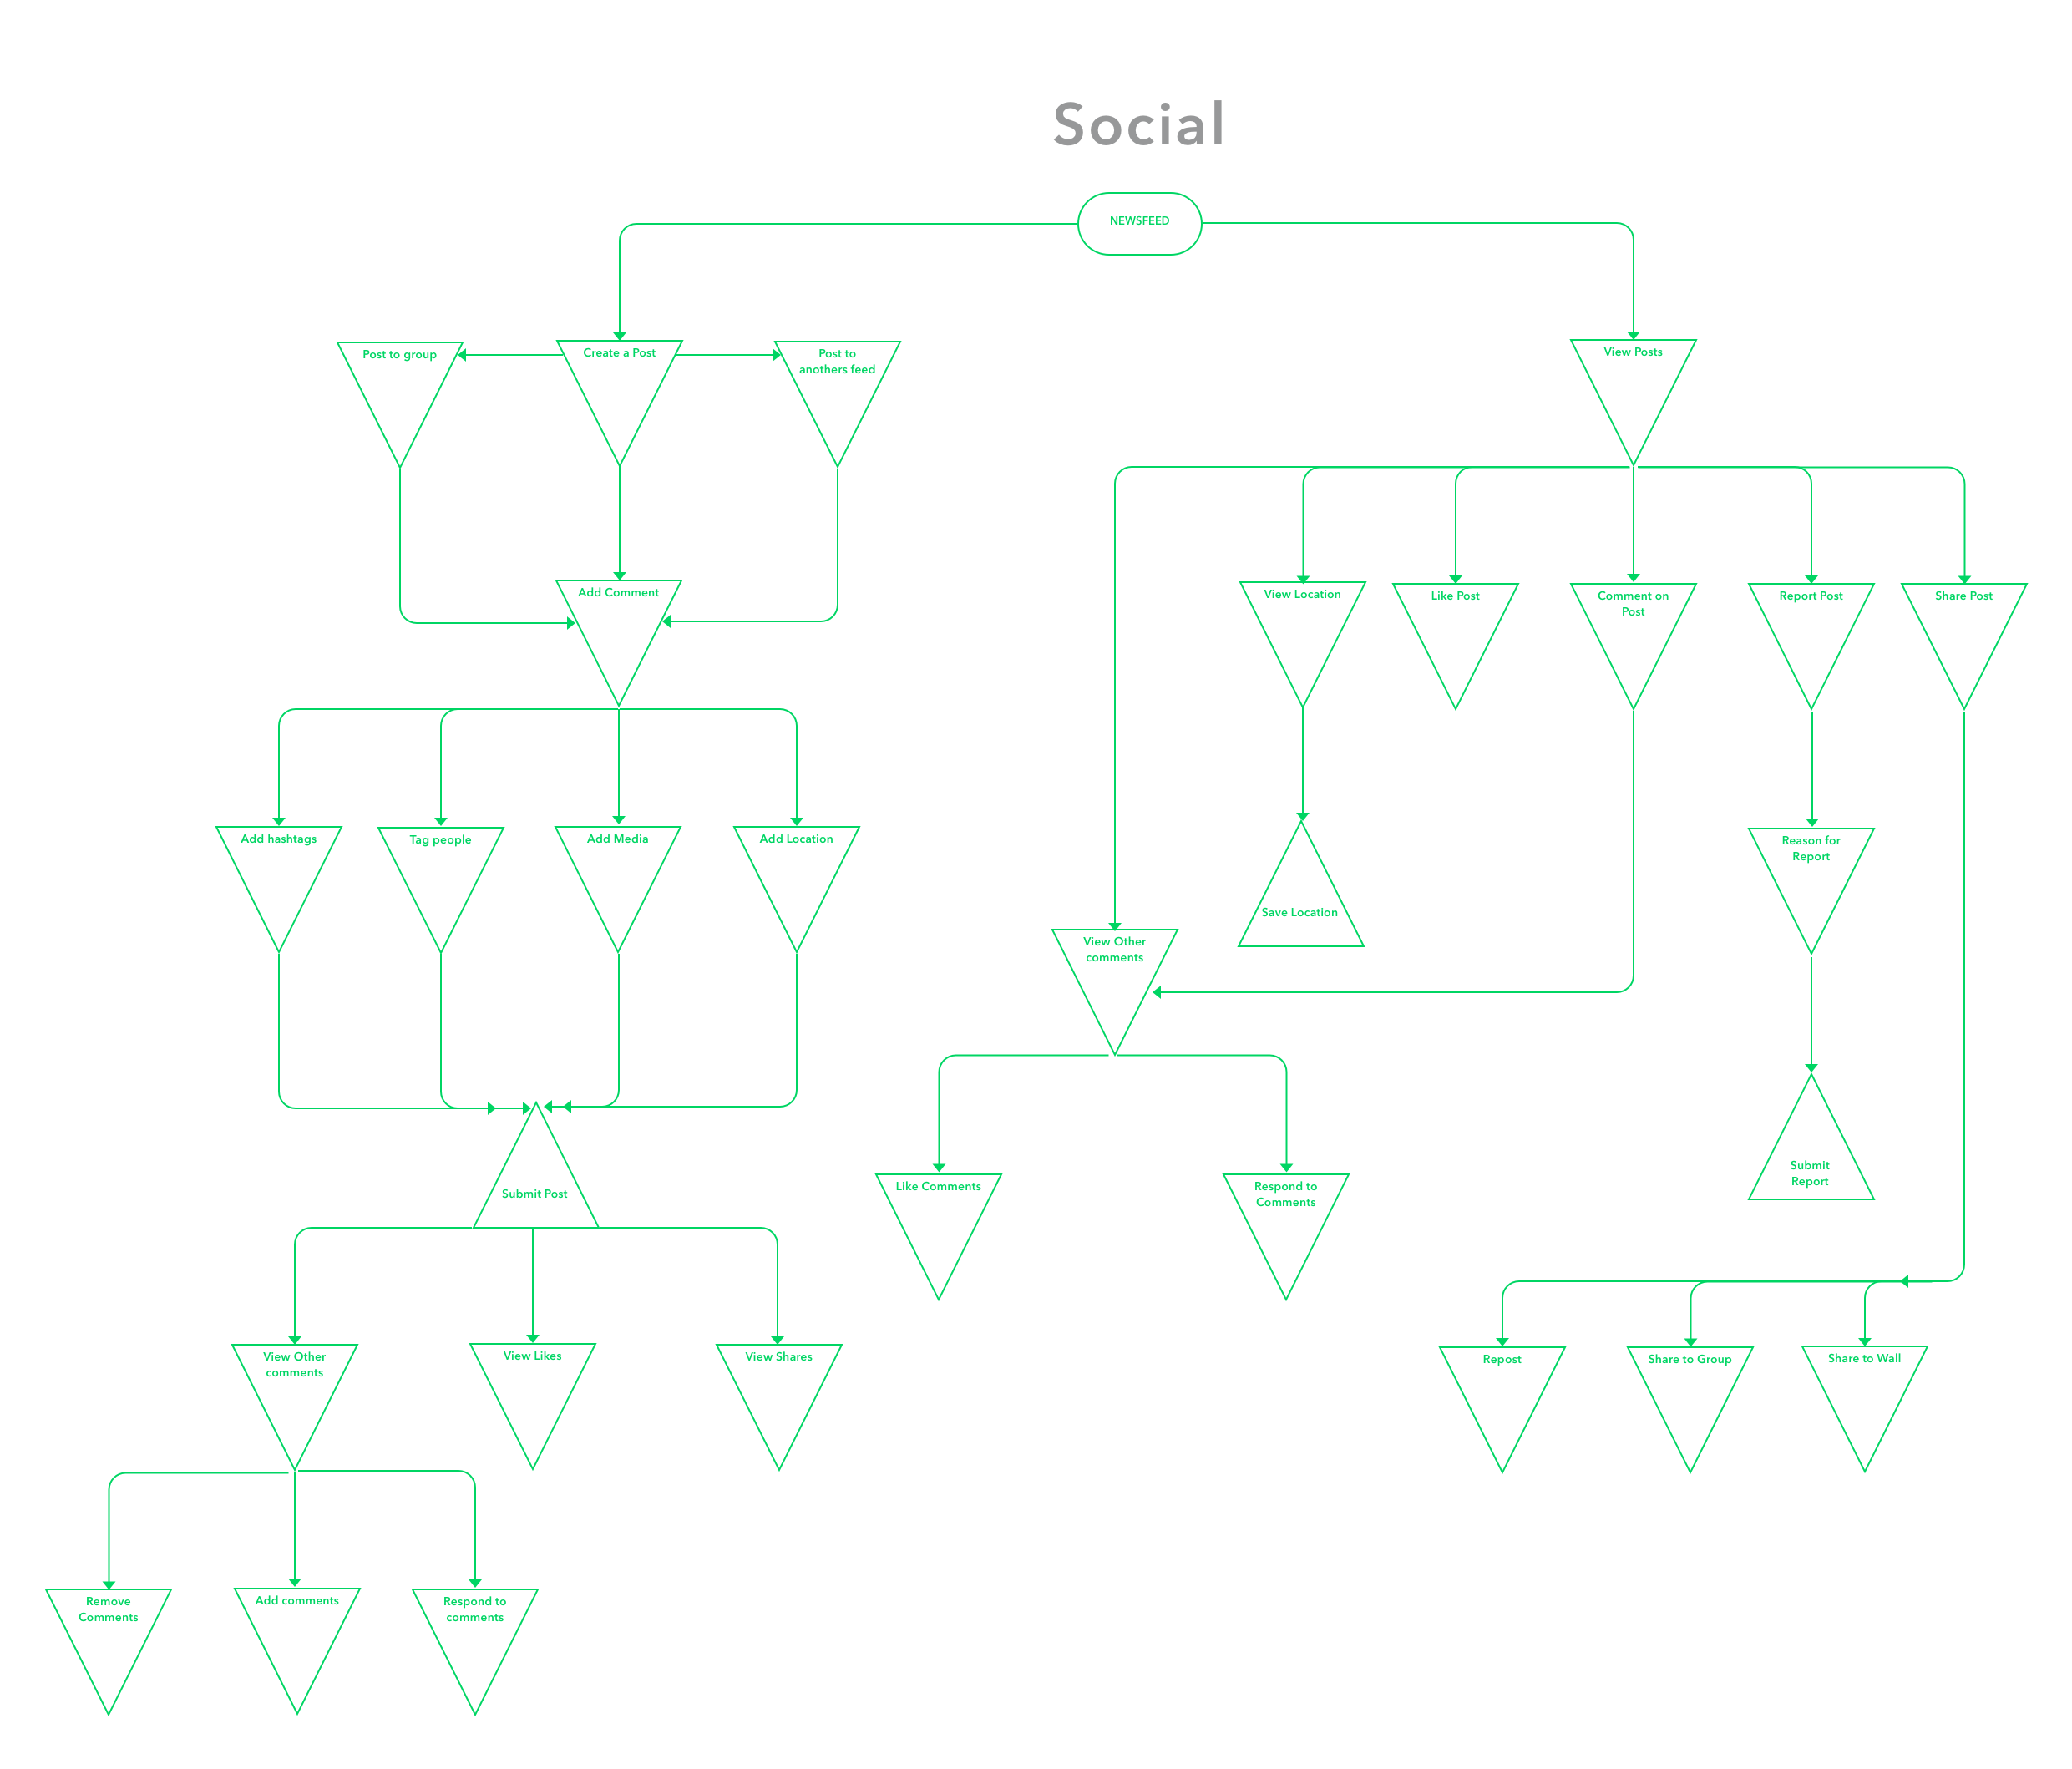
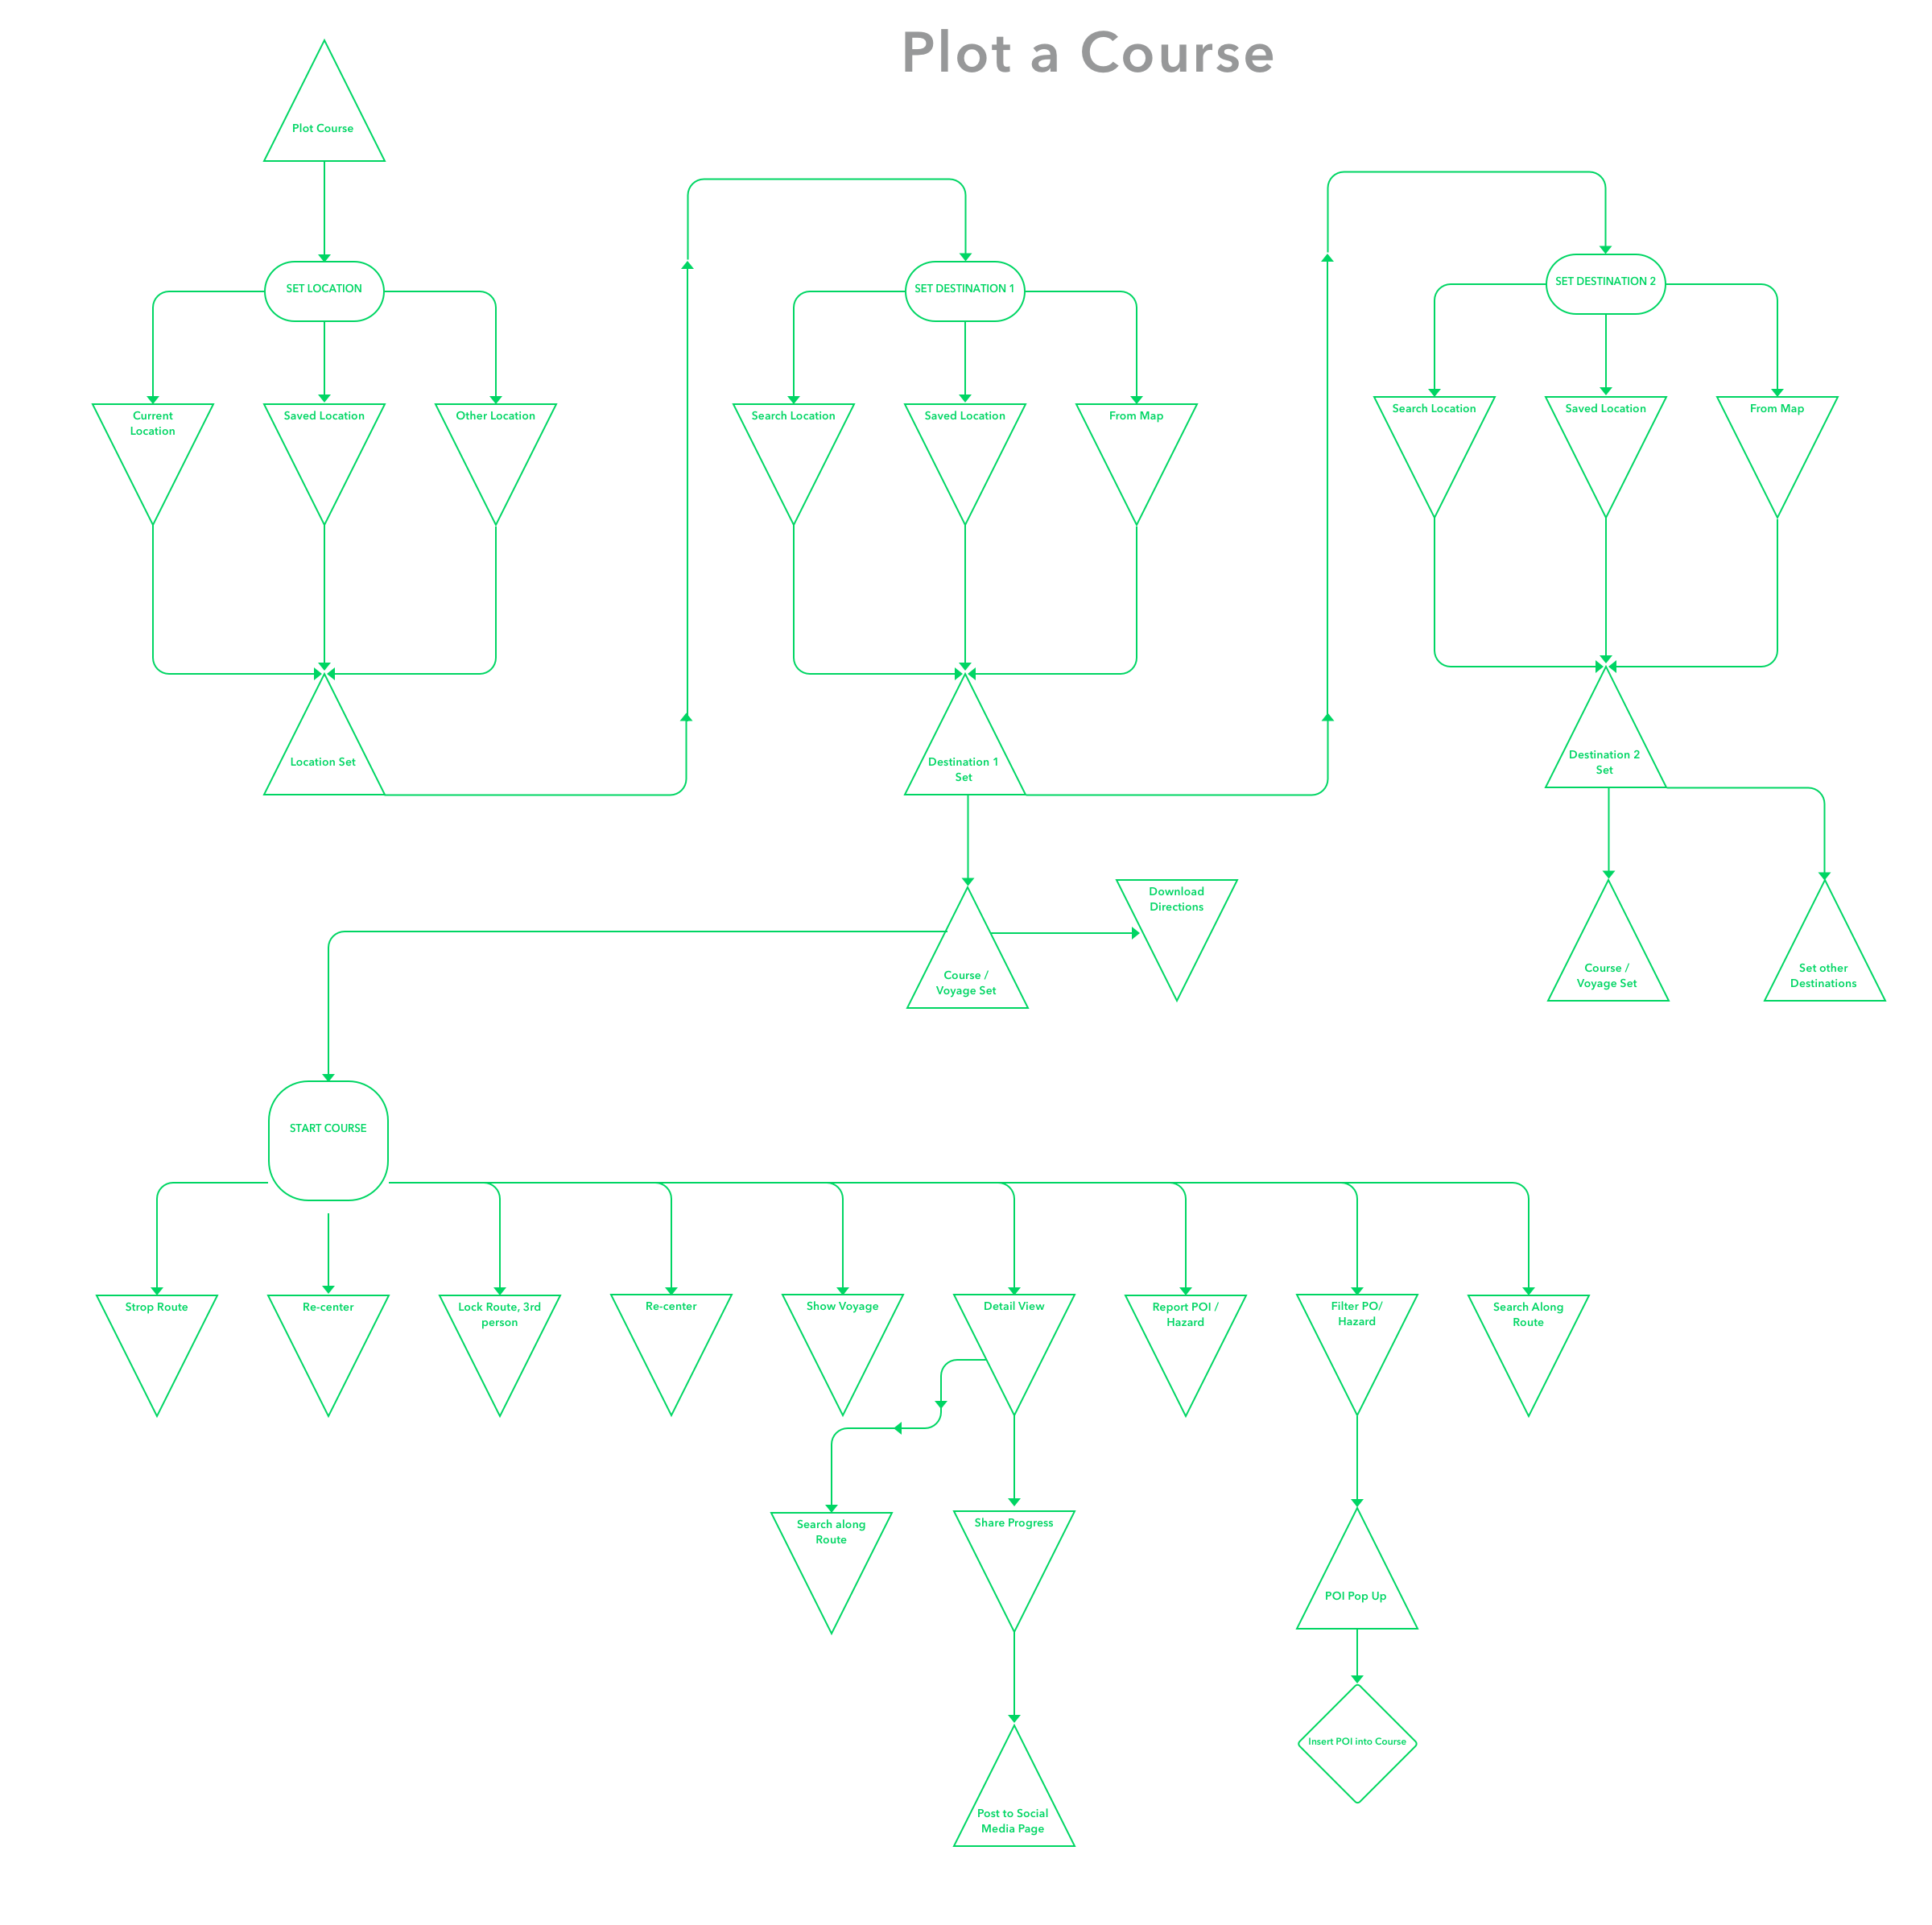
Below are some of our initial user flows showing:
– Search
– Posting to a feed and pins
– Plotting a course

Initial User Flows
Design & Iteration
QUICK SKETCHES
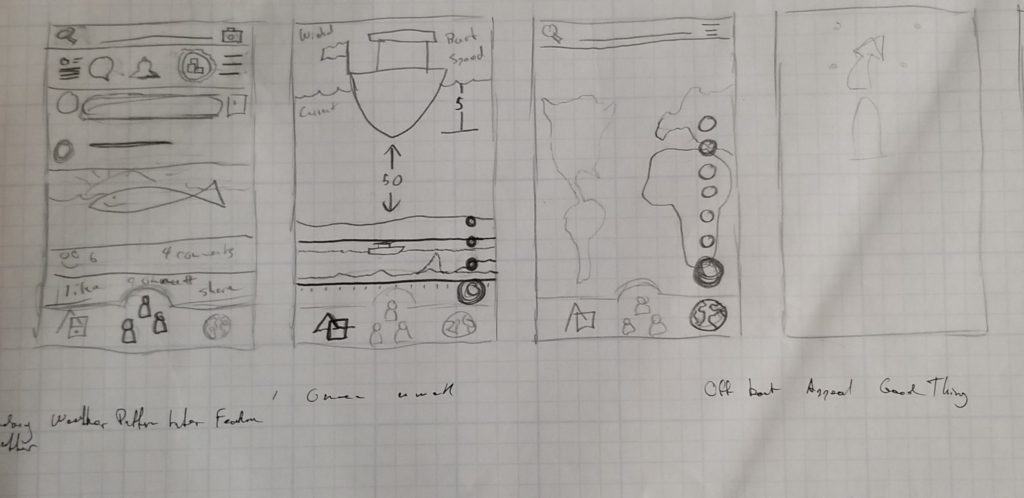
- Users wanted a way to have live, up to date information about what was happening on the water. A news feed solved this without the need to search the map.
- Users expressed they like to explore with no destination in mind, but would like to know the depth under them and if it will potentially get shallow based on their current direction.
- An overall map view with a FAB implementation for reporting pins.
- A rough concept of a page for when the user is en-route and zoomed in on the current location.
Prototype #1
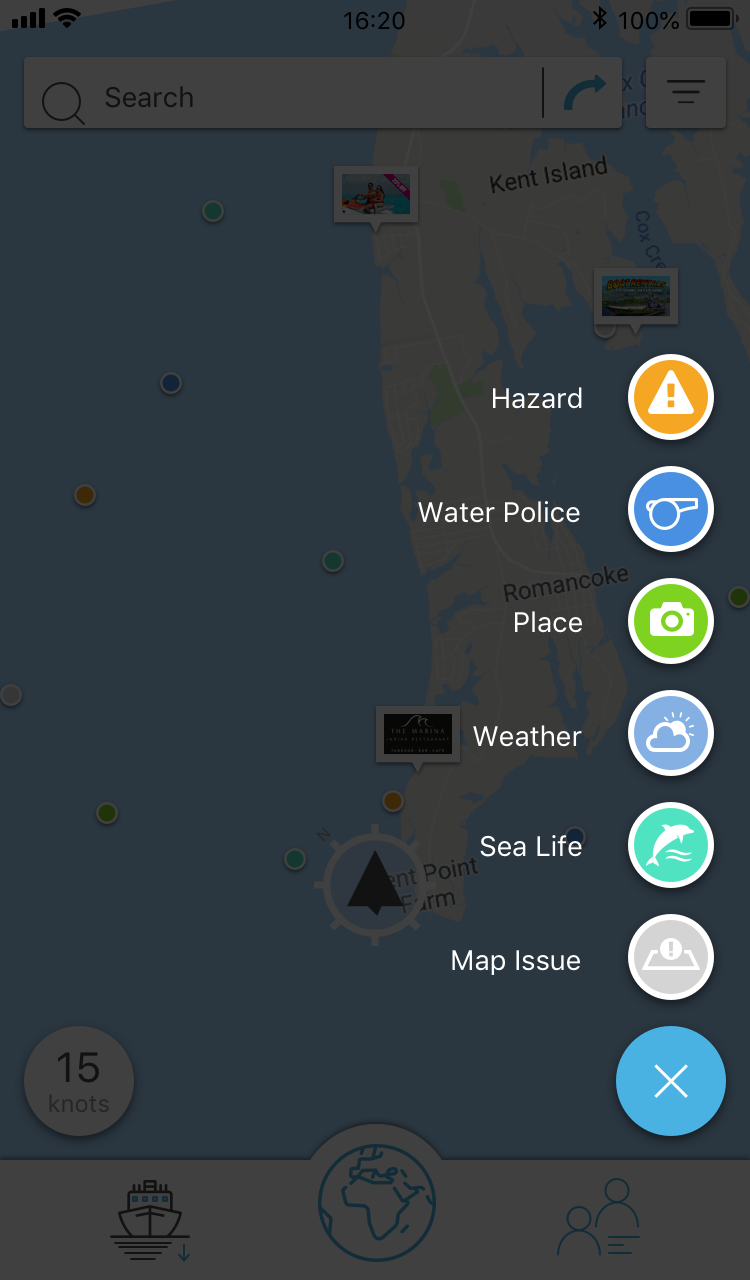
- Fab implemented as a way to drop pins on the map.
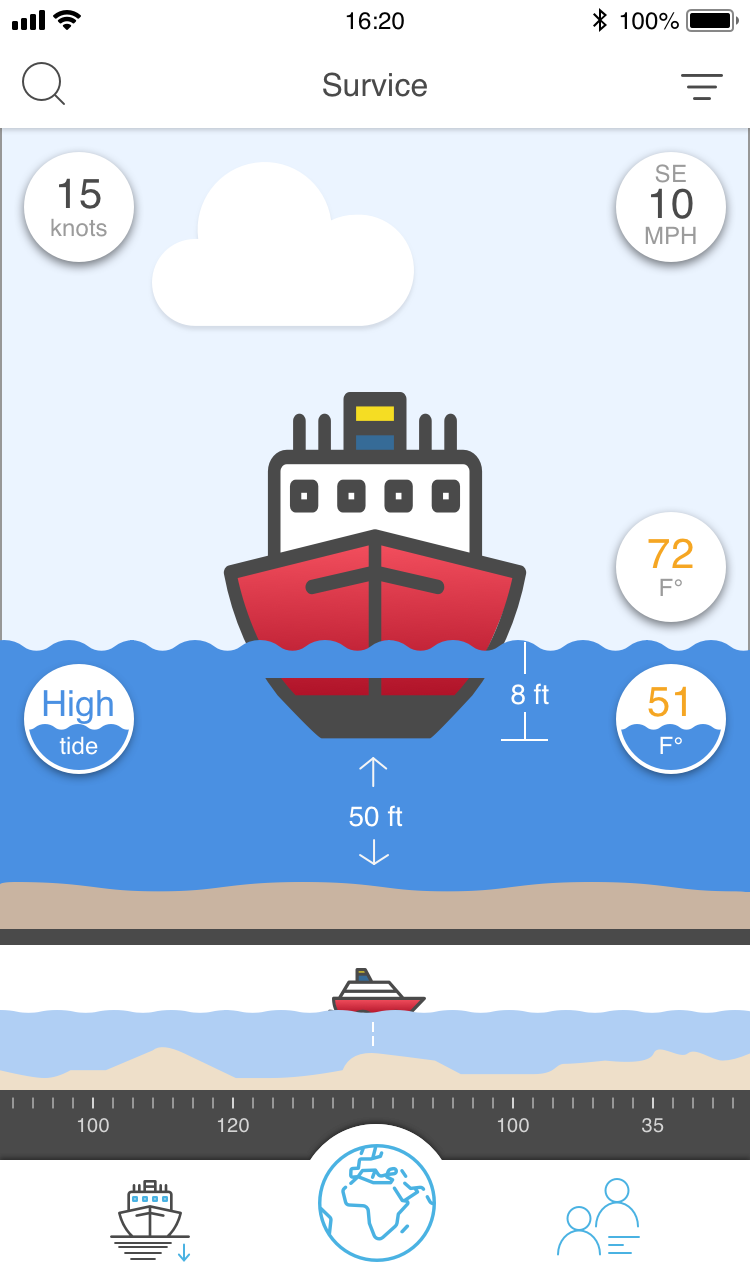
- Depth detail page that also provides valuable information even if you do not have a course laid in.
- Page also intended to incorporate other APIs for weather & tide information.
- An extremely simple interface for basic directions. There are no roads and we wanted to provide verbal directions but it was out of scope.
- We also wanted to adjust ETA’s and directions based on an averaged speed. The initial ETA would be based on what the user put as their average speed in their profile.
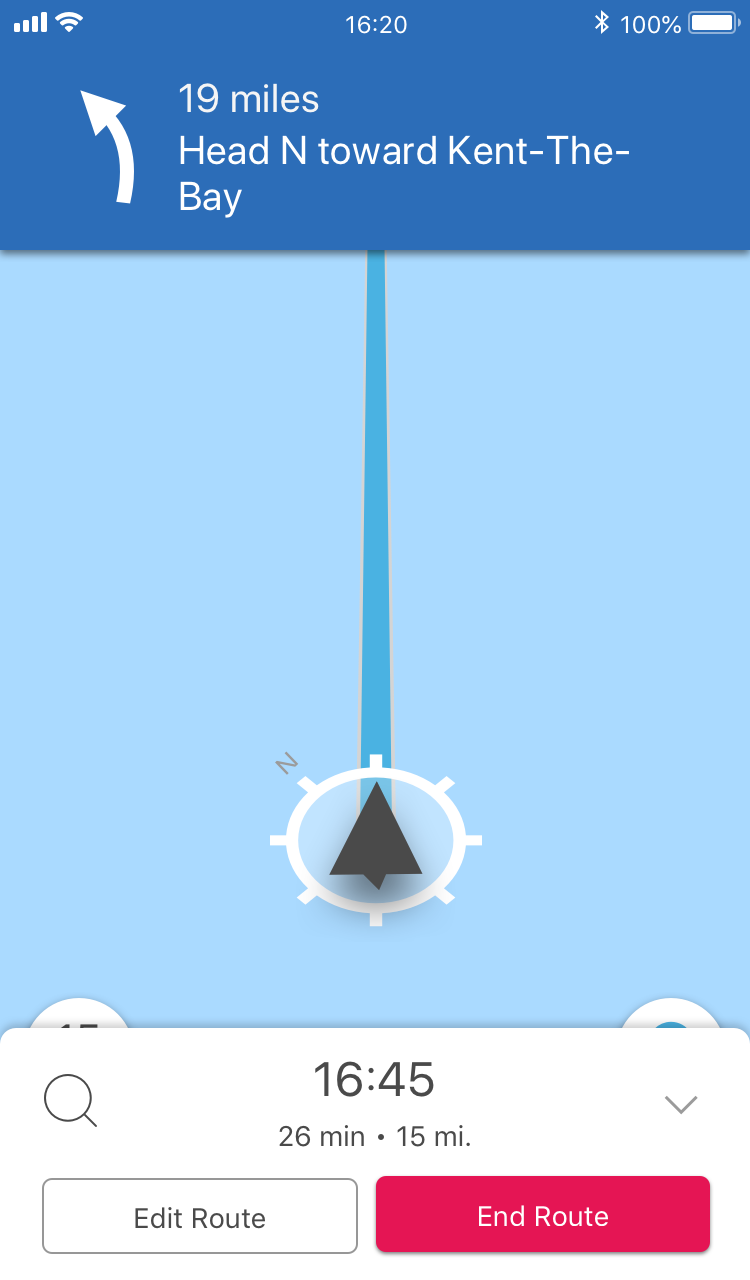
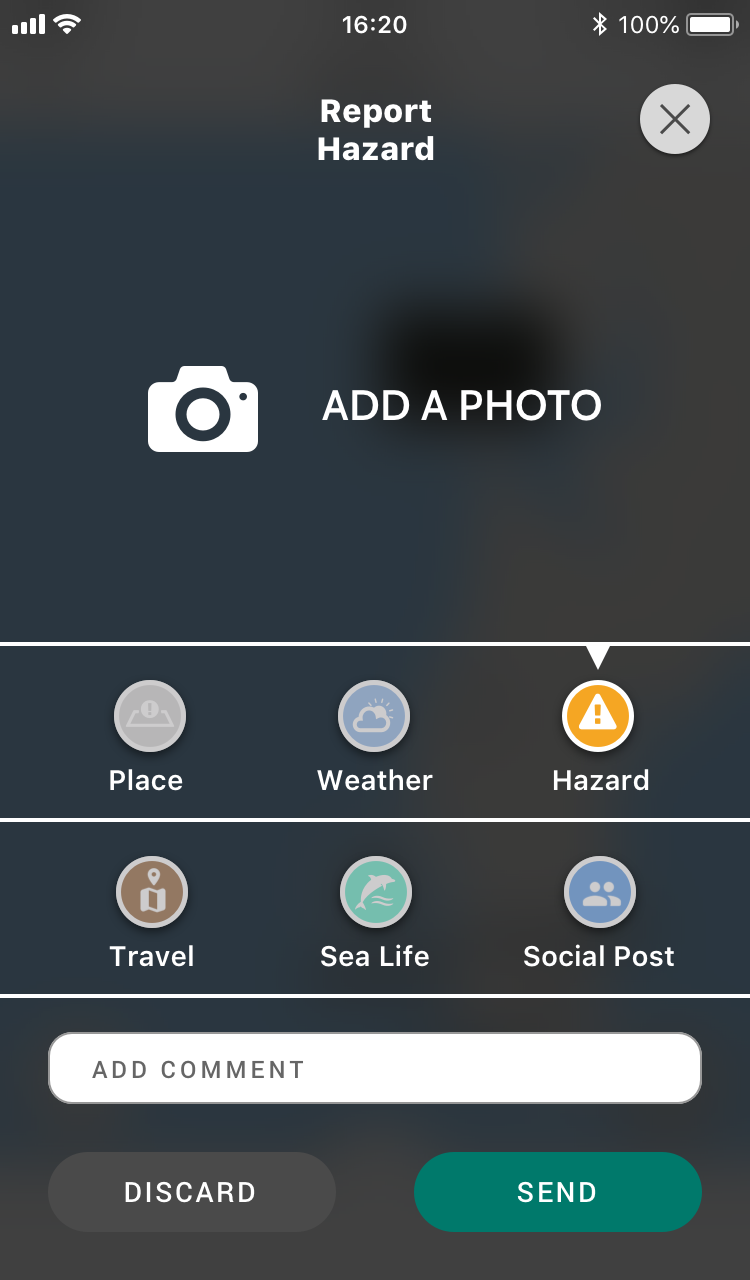
Iteration #2 Mockups
- In our research, we noticed that many other app maps were cluttered resulting in a cognitive overload for users.
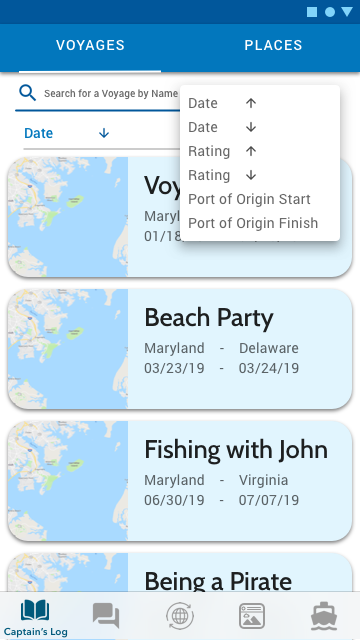
- Users wanted information but not to be overwhelmed. By creating categories we let users organize and filter their maps to provide them only with the information important to them.
- We decided to store the “voyages” the user had taken and the “places” they had gone.
- They then had the option to share these or simply select a voyage or a place and go there again!
- Manual routing was something we planned out but did not implement until much later.
Implementation & Collaboration
These were some of the “features” we were attempting to get pushed out in 3 months. These are not currently prioritized but it is plane to see that not all of this can be accomplished in 3 months. This lead to many conversations with developers about variations to the design and how something could be done so it would take less development time. These variations and the pros and cons were communicated to the stakeholder who would decide which version of a feature we would move forward with and build.
Even after the first 3 months, the drive for multiple features to be developed quickly resulted in the team attempting to cut back on features in order to deliver something. This resulted in significant back and forth between design and development in order to optimize for efficient developer solutions. While this did give the team the opportunity to build, test, and learn it also resulted in a few incomplete experiences which we eventually overcame.
- Groups
- Notifications
- Push Notifications
- News Feed Posts
- Points of Interest
- Friends – Requests, import from Facebook
- Fleet – tracking people
- Map View – Location-based reporting
- User Analytics
- Routing
- Personal Profile – Interest for group suggestions and news feed customization
- Friends
- Invite in-app and to the app
- Registration / Log In with email, Gmail, Facebook
- Camera Integration
- Notification Preferences
- Report a Problem
- Settings and Privacy
- User Admin
- Friend Suggestions
- Messaging
Evaluation & Observation
PROTOTYPE FEEDBACK
- The prototype was tested in Maryland only.
- About 1/3 of users signed up and where remote while the rest were split between users at urban & more rural marine stores.
- Prototype feedback was generally positive.
- People found the technology interesting, fun, and easy to use but in general, there was not a sense of need or urgency around the technology and it’s capabilities.
- Many users simply explored with no navigational aids even if they were available.
- Many users also expressed that they had regular spots they had been going to for years and would not somebody finding their, “secret spot.”
FIREBASE IMPLEMENTATION
Communicating the importance of setting up the needed tools to acquire user data was no small tasks and took time but was well worth it once implemented. Not only does the team now have access to valuable insights, but we are also able to send out automatic notifications when X amount of time has passed between certain events leading to a better and more connected user experience.
METRICS
- Drop off rate
- Profile creation events
- Plan a Voyage
- Complete a Voyage
- Dropping a Pin
- Creating a Point of Interest
- Reviews Left
- Friend Actions
- Messaging Actions
Conclusion
BALANCING PRODUCTION SPEED, COST & REDUCING RISK
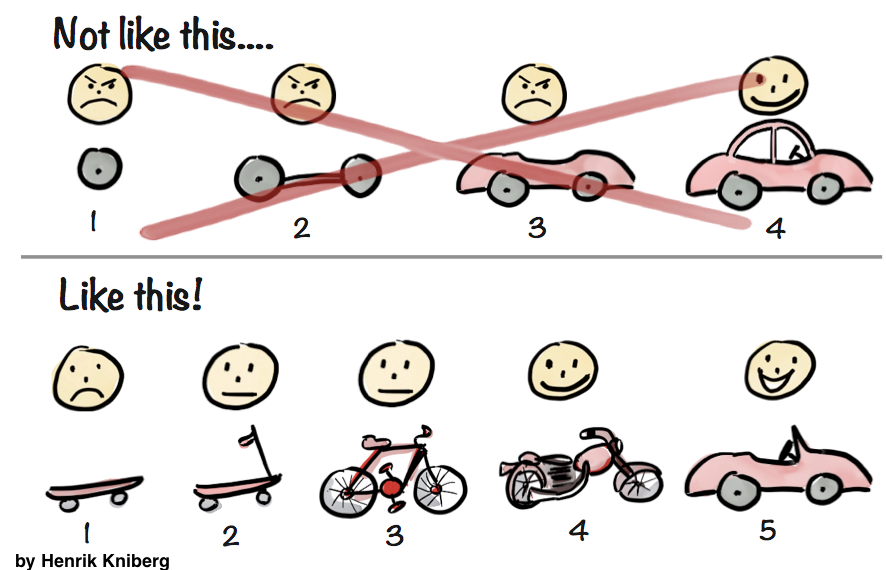
The term MVP gets used alot and many entrepreneurs who have read the book, “The Lean Start Up” do their best to implement the ideas put forth in this book.
Like many things, the concept and the idea of an MVP are much easier said than done. On this project I learned a ton regarding how to implement minimal features and iterating upon those features. I learned enough to know I did not always get it right and found that communicating these ideas to stakeholders successfully also requires communicating exactly what we will learn from doing it a specific way and why it is better than the other options on the table. Communicating an idea and the data that supports it is simply not enough. A story must be told for each possible way of doing it with each eventuality with your pros and cons hopefully extremely clear. Depending on situation and resources however, this is not always possible.
I also found that if you know part of the experience needs to be. It can be best to implement it 100% or as fully as you can. Not doing so can make it difficult to learn from your users. If you make an experience 1/3 of what it should be, then you know exactly what your users are going to say about an unfinished experience. At this point you are not learning much if anything at all and it is best to get it to point where you can learn something new, or test and assumption or hypothesis.
